Grey1
Senior member
- Messages
- 2,190
- Likes
- 210
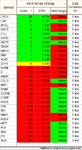
Enclosed find the code to identify the strong or weak stocks intra day ,,
Settings are 10 min and 14 ATR
Radar screen on 1 min
The code tells you how much each stock gains or losses intra day last past 10 min ,
This is how you use the code
Step 1 you sort the CENTS fromn highest to lowest,, Use Auto sort for every 5 seconds then you donot have to keep sorting it manually .
Step 2 you look for a period that INDU 1 min goes through consolidation .( from INDU chart )
Step 3 you then identify which stock gained most when INDU was consolidating .. This is your strong stock ,,
There are two ways of using this code,,
Time between 3.30 UK time -7.30 UK time .
a) Oscillatory Trading ……During this time market often oscillates, Hence most of the stocks . you wont expect trending stocks and even if they do trend the trend does not last long enough for you to make $$ hence ,There for you do not go for catching the trend , you go for shorting rallies and buying dips. The rallies can happen in stocks which are in negative or positive in the day ,, ( the code shows them as ABOVE or BELOW ).. Shorting the stock that are in positive for the day is more rewarding but more risky ,, (shorting the stocks that are in negative is less risky but less profitable. ) // I leave this choice to yourself , This technique is Anti Trend and you are continuously scalping the rallies ,, so do not expect major return.. I often take 20 Cents with large positron size as you all have seen in my TRADE LOGS.
b) Trend Trading … You can use the code to identify the strong and weak stocks and instead of SHORTING the rallies you can LONG the strong stocks on a pull back ( TREND TRADING ) . The pull back is defined by 1 MIN MACCI being OS when 10 MIN INDU is OS on 10 min time frame . To use this to catch the trend you need to confirm a few times to make sure the stock is strong in nature rather than getting hit by a spike from a program traders,, IN another word when market turns around all program traders hit the market and as a result all stocks Spike ,, you don’t want to give credit to any stock being strong if they just gained CENTS when program trader hitting the broad spectrum of the stock. The advantage of Trend trading is you can use much lesser position size and let the inherent trend to prevail and pay you in a longer time. Trend trading is far better than oscillatory trending and is more suitable to most new traders.
Using a) needs fast finger with fast , decisive attitude ,, b) is more relaxed as you going for the trend and it could take hours before you eventfully enjoy the trend ride ,,
REVERSE FOR LONG
You can also sort the stocks based on their ATR ..
There are many other ways of using it and i leave this for you to experiment with it
Please donot not pass the code around ,, Thx
Grey1
Attachments
Last edited: