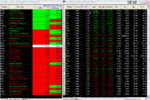
Program Trading: Strong/Weak Stock Selection

In developing a suitable strength or weakness indicator relative to INDU my view is that we could use a measure of ATR for a stock relative to ATR of INDU. So if INDU has moved by 0.7 ATR upwards we then rank all stocks by ATR upward movement as well. The stocks with the highest positive ATR would be the most suitable candidates for a Long trade.


Paul
 
In developing a suitable strength or weakness indicator relative to INDU my view is that we could use a measure of ATR for a stock relative to ATR of INDU. So if INDU has moved by 0.7 ATR upwards we then rank all stocks by ATR upward movement as well. The stocks with the highest positive ATR would be the most suitable candidates for a Long trade.
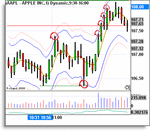
Apologies to the OP if this is too far off topic, but in response to Paul's suggestion, I have an EFS study for eSignal that might be of interest. It doesn't do quite what Paul suggests, but it's a step in the general direction. The study plots bands (similar to Bollinger Bands) above and below a central line. The default setting for the central line is a 5 period weighted moving average, although this can be changed to anything you want. The upper and lower bands are plotted according to a multiple of the stock's ATR. In a flat / rangebound market it is an excellent overbought / oversold indicator. The dark bloo lines on the chart attached are my default setting of 1.5 x ATR, as price tends not to go outside these. The pink bands are set to 2 x ATR and is where I place my maximum stop. In a rangebound market, if price kisses or breaches the upper band, then a short trade is signaled as it's very likely to 'return' to the mean of the 5WMA (central gold coloured line) within 3 candles at most. Vice versa for longs. I must stress that this is potentially disastrous if the stock and/or market are trending; it's only for flat, rangebound conditions. As with any indicator, entering a trade just because price has hit some arbitrary line is a recipe for disaster. However, combined with S/R and volume etc, I find it very useful. The first 'hit' circled on the AAPL chart is the 11.01 candle would be a risky short entry on the grounds that price is moving higher strongly, evidenced by the angle of the lines. As it happens, the trade would have been profitable. However, the 11.11 long signal is a cracker. It's also at an area of support, evidenced by the double bottom, provided by the 10.57 candle. The 11.16 to 11.19 candles all touch - or come close to touching - the upper band. However, it's obvious that AAPL is trending up strongly by this time, so no short trades are indicated. That said, so long as one went short very close to the upper band, you should have been able to cover at breakeven at worst in all four cases and may even have made a small profit.

As I've contributed very little (okay then, nothing) to this forum since I've joined, I'm happy to make the study available to everyone here who wants it. As I own the copyright, I would ask that it's restricted to members of this forum only and not posted elsewhere or even passed on privately without my permission. I can't attach it to this post as T2W software doesn't support the the file type that the study uses, but I'm happy to e-mail it to anyone that wants it. Hope someone finds it of use, feel free to ask any questions!
Cheers,
Tim.
 

Attachments

  • AAPL_EFS_Study_31_10_08.gif
    AAPL_EFS_Study_31_10_08.gif
    17.8 KB · Views: 29
A note on the above ELD. At the end of running it, we'll have global variables as follows:

With this on radar screen with 5 symbols you'll have the following (example data):

List

1 IBM
2 GE
3 AMZN
4 BBBY
5 APOL

Value Per Symbol
TTListIBM 27.6
TTListGE 32.1
TTListAMZN 21.2
TTListBBBY 88.1
TTListAPOL 54.1

Flag For Symbol (to say item is defined in list & doesn't need to be again)
IBMdefined Y
GEdefined Y
AMZNdefined Y
BBBYdefined Y
APOLdefined Y

Now - when we put on a sell, we'll rate these BUT we aslo need the position size. The #TT_POSITION_SIZE ELD attached is the same position sizing algorithm that was posted on this forum previously with the following added :

Code:
ReturnCode = GVSetNamedFloat("TTPosSize" + getsymbolname,IntPortion(PSize));

Add this to a radar screen with the same symbols as your main radar screen but with the interval set to your position sizing interval and it will generaet the following additional global vars

Position Size Per Symbol
TTPosSizeIBM 100
TTPosSizeGE 50
TTPosSizeAMZN 90
TTPosSizeBBBY 112
TTPosSizeAPOL 70

So now we have a list of stocks, a way to store their strength & a way to store their position size.

Cheers

Pete
 
OK - I had a stab at this....

#TT_RATE_WEAKSTRONG : This is just a 'placeholder' we will do 3 things in this ESL
1 - call a function to get a strength value (to be decided later)
2 - Call a function TT_SET_ARRAY to store that value see next ESL
3 - Plot the indicator value

Code:
Vars : ReturnCode(0),RelativeStrength(0);
// Call a function to analyze the strength/weakness of a stock and produce a value
	
RelativeStrength = getappinfo(aiRow);

// Now call a function to put this data away for use at trade time

ReturnCode = TT_SET_ARRAY(RelativeStrength);

//Plot the relative strength

Plot1(RelativeStrength,"Strength");


Note - the line "RelativeStrength = getappinfo(aiRow);" is just a dummy line & needs to be replaced with a real calculator for strength/weakness.

TT_SET_ARRAY :
1 - accepts the strength indicator value from the caller
2 - puts the symbol name into a list of symbols that we'll use at order time
3 - stores the strength value in a named global variable who's name is "TTList + symbol name"
4 - stores the number of symbols in a global variable called "SymbolListCount"

Code:
inputs : SortIndicatorValue(Numeric);
vars : SymbolListCount(0), ListPosition(""), ReturnCode(0);

// has symbol already been defined in the symbol list ?
if GVGetNamedString(getsymbolname + "defined","N") <> "Y" then begin
   ReturnCode = GVSetNamedString(getsymbolname + "defined","Y");
// Get next position number 
	SymbolListCount = GVGetNamedInt("SymbolListCount",0);
	SymbolListCount = SymbolListCount + 1;
// Put the name of the symbol in the symbol list at the new position
	ReturnCode = GVSetString(SymbolListCount,getsymbolname);
	ReturnCode = GVSetNamedInt("SymbolListCount",SymbolListCount);
print(SymbolListCount, " ",getsymbolname);
end;
ReturnCode = GVSetNamedFloat("TTList" + getsymbolname,SortIndicatorValue);
TT_SET_ARRAY = 1;

So at the end of this, we have a list of symbols and a value for each symbol that we can load into an array for sorting later.

Capiche ???

I may do the load later on - it'll make more sense then. For now - just test this out on your n min change radar screen to see the print statements. The print statements are just the list of symbols, not their strength. If you add another symbol to radar screen you'll see another entry. This list will stay until you close tradestation.

My image is we have a TT_GET_ARRAY that gets the list of symbol names & strength values then puts them in an array so we can sort them get the list of stocks to trade.

This is just the start but the array processing to store & sort the weak/strong values is a technical hurdle we needed to overcome.

Let me know if you think you can improve on this. ESL Attached.

Cheers

Pete

Pete

You are in LA at present which is so apt, as you are a star.

However I don't know if it is just me, but the download doesn't seem to work, could you reattach it or send me a copy by PM please.

On the issue of the sequence of processing that we discussed by PM, you may find the following page useful

https://www.tradestation.com/wiki/d...ynchronization+Techniques?decorator=printable

For the benefit of others I have not yet run a strategy against the 6 timeframes referenced in the indicator TT-ENTRYPOINT that gives the correct readings in backtesting, although they looked ok during the market session. We believe this has something to do with the order in which TS processes statements within and across charts.

Charlton
 
Thanks Charlton.

Here's all ESLs - so be careful with the import if you have changed anything. What problem did you have with the last one ? Just didn't import ?

I'm having trouble storing the sector for each symbol. It worked once but after that didn't work again. I have no idea what I did.

I was in the process of cleaning up the global variable names when I saw your message. Currently they should be :

TT_ENTRYPOINT
TTTrigger- trigger for trading. "SellShort" or "Buy

#TT_MTL_Cycle
Zone60 - where the 60 min is in the cycle. "OB", "OS", "MID"
Also - Zone30, Zone10, Zone5, Zone3, Zone1
Direction60
- where the 60 min is pointing. "+","-","F"
Also - Direction30, Direction10, Direction5, Direction3, Direction1

#TT_POSITION_SIZE
TTPosSizesymbol- Position size for symbol
TTBasket- Number of stocks to trade

#TT_RATE_WEAKSTRONG (TT_SET_ARRAY)

TTDefFlagsymbol- Tells us if we have added this symbol to our symbol list yet (for performance)
TTSymbolListCount- Number of symbols in our list
TTStrengthsymbol- Strength value for symbol
TTSectorsymbol - Name of sector for symbol

Numbered Strings
1,2,3,4,5 etc - contains symbol Name
 

Attachments

  • TT_ALL.ELD
    18.1 KB · Views: 13
Last edited:
Thanks Charlton.

Here's all ESLs - so be careful with the import if you have changed anything. What problem did you have with the last one ? Just didn't import ?
Thanks for the code - the problem was with T2W. When I clicked on the attachment it opened up a window saying Done, but did not give me the option to open or save the file.

I tried using getappinfo(aiRow) on Friday, but it seemed to retain the row number it initially created for each symbol rather than update it, but to test this properly ideally the market should be open so I did not have a chance to take it further at the time.
I'm having trouble storing the sector for each symbol. It worked once but after that didn't work again. I have no idea what I did.

I tried going into the code for sector, which basically is FUNDSTRING, but I cannot get entries to show in radar screen, when I incorporate it. I just get error showing up . The indicator itself works (sector) if placed in RS.

Charlton
 
Thanks for the code - the problem was with T2W. When I clicked on the attachment it opened up a window saying Done, but did not give me the option to open or save the file.

I tried using getappinfo(aiRow) on Friday, but it seemed to retain the row number it initially created for each symbol rather than update it, but to test this properly ideally the market should be open so I did not have a chance to take it further at the time.


getappinfo is only in there for now as a placeholder - it needs replacing with the indicator for strength/weakness at some point in the near future...

I have just done my last update for the day. Just to check that all these global vars are OK.

TT_GET_ARRAY

Code:
var : LoopCount(0), Basket(0), CurrSymbol(" "), NumElements(0), ReturnCode(0);

// Set Array for sorting - I wanted to use a dynamic array but I didn't know how to do a 2dimensional 
// dynamic array

Array: RadarValues[200,2] (0);

// Set basket size
	Basket = GVGetNamedInt("TTBasket",BASKET);	
	NumElements = GVGetNamedInt("TTSymbolListCount",1);

// Loop around the symbol list - TTSymbolListCount is the list of symbols

for LoopCount = 1 to NumElements Begin
	// element 1 = strength (to 5 decimal places)
	RadarValues[LoopCount,1] = GVGetNamedFloat("TTStrength" + GVGetString(LoopCount),0);
	// element 2 = symbol number
	RadarValues[LoopCount,2] = LoopCount;
end;

// Now Sort the array by strength
// last element = -1 ascending, 1 descending
// has to be descending sort

ReturnCode = Sort2DArray(RadarValues, NumElements, 2, 1);

// Now print out the array 
for LoopCount = 1 to NumElements Begin
	CurrSymbol = GVGetString(RadarValues[LoopCount,2]);	
	Print("Symbol ", CurrSymbol,
		", Strength ", RadarValues[LoopCount,1],
		", Position Size ", GVGetNamedInt("TTPosSize" + CurrSymbol,0),
		", Sector ", GVGetNamedString("TTSector" + CurrSymbol," "));
end;

TT_GET_ARRAY = 1;

It does indeed appear to print a sorted list.

I put the following on the end of #TT_ENTRYPOINT

Code:
// For testing only - if this is the last bar on the chart - output the array
// Switch this off if running in real time
	
if LastBarOnChart then
	ReturnCode = TT_GET_ARRAY;

So when running off line, it'll print the array. That's just for testing but now at least we have a way of sorting by strenght - a step in the right direction for deciding what to buy/sell.

I haven't done strategies in ESL as this is the first week I've done any real coding with it. Where should we put the buy/sells - on the radar screen itself or on the $INDU ?

Latest update with the sorted array print on it...

Pete
 

Attachments

  • TD_ALL.ELD
    26.4 KB · Views: 18
oops - that print statement on TT_GET_ARRAY should be...

Code:
	Print("Symbol ", CurrSymbol,
		", Strength ", RadarValues[LoopCount,[B]2[/B]],
		", Position Size ", GVGetNamedInt("TTPosSize" + CurrSymbol,0),
		", Sector ", GVGetNamedString("TTSector" + CurrSymbol," "));
 
getappinfo is only in there for now as a placeholder - it needs replacing with the indicator for strength/weakness at some point in the near future...

I have just done my last update for the day. Just to check that all these global vars are OK.

TT_GET_ARRAY

Code:
var : LoopCount(0), Basket(0), CurrSymbol(" "), NumElements(0), ReturnCode(0);

// Set Array for sorting - I wanted to use a dynamic array but I didn't know how to do a 2dimensional 
// dynamic array

Array: RadarValues[200,2] (0);

// Set basket size
	Basket = GVGetNamedInt("TTBasket",BASKET);	
	NumElements = GVGetNamedInt("TTSymbolListCount",1);

// Loop around the symbol list - TTSymbolListCount is the list of symbols

for LoopCount = 1 to NumElements Begin
	// element 1 = strength (to 5 decimal places)
	RadarValues[LoopCount,1] = GVGetNamedFloat("TTStrength" + GVGetString(LoopCount),0);
	// element 2 = symbol number
	RadarValues[LoopCount,2] = LoopCount;
end;

// Now Sort the array by strength
// last element = -1 ascending, 1 descending
// has to be descending sort

ReturnCode = Sort2DArray(RadarValues, NumElements, 2, 1);

// Now print out the array 
for LoopCount = 1 to NumElements Begin
	CurrSymbol = GVGetString(RadarValues[LoopCount,2]);	
	Print("Symbol ", CurrSymbol,
		", Strength ", RadarValues[LoopCount,1],
		", Position Size ", GVGetNamedInt("TTPosSize" + CurrSymbol,0),
		", Sector ", GVGetNamedString("TTSector" + CurrSymbol," "));
end;

TT_GET_ARRAY = 1;

It does indeed appear to print a sorted list.

I put the following on the end of #TT_ENTRYPOINT

Code:
// For testing only - if this is the last bar on the chart - output the array
// Switch this off if running in real time
	
if LastBarOnChart then
	ReturnCode = TT_GET_ARRAY;

So when running off line, it'll print the array. That's just for testing but now at least we have a way of sorting by strenght - a step in the right direction for deciding what to buy/sell.

I haven't done strategies in ESL as this is the first week I've done any real coding with it. Where should we put the buy/sells - on the radar screen itself or on the $INDU ?

Latest update with the sorted array print on it...

Pete

Pete

Thanks for the amended code - I will look at all the code you have produced. The strategy should be inserted on the 1 min $INDU chart.

The guts of the strategy will be a series of IF statements along the lines of:

If
GVGETNAMEDSTRING("Trade_Action", "Error Message") = "Sell"
THEN BEGIN
Sell ("Sell") next bar AT MARKET ;
END;

So within the Showme #TT_ENTRYPOINT would be something like:

Output = GVSETNamedSTRING("Trade_Action", Trigger);

print(gvgetnamedstring("Trade_Action","Error Message"));

The value of trigger is placed into a GV that is then read in the strategy to generate a sell/buy. We will also need to pull in the position size into a statement looking like

Buy Value1 shares next bar at 100.50 limit;

where value1 is the position size fetched from the global variable.

Further additons will be to check whether a position is already open for the symbol (especially for determining the exit), adding stops etc, but for the moment I would suggest that we limit the strategy to just opening 1 or more long positions in a trending market and closing them at the next sell signal. Refinements such as 75% close etc can come later.

Anyway this is a great start and we have plenty to work with. I haven't got any further at present with the forcing of global variable sequencing. At present I am thinking we may need to create a GV corresponding to every minute of the session - not something I really would like, but if the processing goes through each chart in turn then it may be the only way to compare bar by bar.

Charlton

Charlton

I'll pretend I understand all that. :eek: I was thinking it'd be good to be able to do it from the $INDU chart as soon as we have the signal but I wasn't sure if we could trade other symbols or multiple symbols from the $INDU. The other solution I had thought would be to set a buy/sell global variable for each symbol "TTActionsymbol" = "Buy/Sell" and do the management on the radar screen object. I do think the best place for it is on the $INDU 1 min though. That's the logical point.

Sounds like you'll have to be the man doing the coding on the trade side. I cant get my head around the documentation on this subject.

- can we do multiple trades for multiple symbols on the 1 min $INDU ESL ? I think if we added in the TT_GET_ARRAY code there, it would be easy to pick the top/bottom n stocks.

- the sector code can be fixed by using :

Sector = GetFundDataAsString("F_MGSEC", 1); I have no idea why this works and the other command doesn't.

Now, I have DEFINITELY finished for the day - I need to go for a run along the beach now !

As for the sequence of execution - maybe we just have to test each component in turn and then just forward test the strategy when it's all put together. I would like to backtest but this is a bit of a show stopper...

Cheers

Pete
 
Last edited:
Day finished

Charlton

I'll pretend I understand all that. :eek: I was thinking it'd be good to be able to do it from the $INDU chart as soon as we have the signal but I wasn't sure if we could trade other symbols or multiple symbols from the $INDU. The other solution I had thought would be to set a buy/sell global variable for each symbol "TTActionsymbol" = "Buy/Sell" and do the management on the radar screen object. I do think the best place for it is on the $INDU 1 min though. That's the logical point.

Sounds like you'll have to be the man doing the coding on the trade side. I cant get my head around the documentation on this subject.
No problem - leave that bit of code for me
- can we do multiple trades for multiple symbols on the 1 min $INDU ESL ? I think if we added in the TT_GET_ARRAY code there, it would be easy to pick the top/bottom n stocks.
Doing multiple trades in itself is no problem. Once we have the output from the top/bottom stocks, which I still think will be the tricky bit, because I have yet to see the dynamic re-sorting work.

- the sector code can be fixed by using :

Sector = GetFundDataAsString("F_MGSEC", 1); I have no idea why this works and the other command doesn't.
It's good to sort that one. I didn't come across this alternative command when I was looking

Now, I have DEFINITELY finished for the day - I need to go for a run along the beach now !

As for the sequence of execution - maybe we just have to test each component in turn and then just forward test the strategy when it's all put together. I would like to backtest but this is a bit of a show stopper...

Cheers

Pete
Well - you deserve the run after all that.

Charlton
 
Charlton - I presume you are in the US too, right ? Or are you nocturnal ?

Well done for passing the test & spotting my intentional mistake :whistling

I had to get a better sort routine in there.

In #TT_RATE_WEAKSTRONG I did this :
Code:
// Call a function to analyze the strength/weakness of a stock and produce a value
//RelativeStrength = getappinfo(aiRow);
RelativeStrength = RSI(Close, 14);

So now we'll be sorting by RSI just for testing purposes.

Then I found a decent array sorter & plugged it into TT_GET_ARRAY.

Code:
ReturnCode = TTsortD1basedOnD2key(RadarValues, NumElements,2,1,1);

New ELD attached. Workspaces are in the attached zip file (which is actually a rar file but T2Win won't let me upload rars :rolleyes: )

Out of trading hours, open workspace #PD_MACCI_RADAR first then open #PD_MACCI_CHARTS.

Lo & behold on the print log you will see...

Symbol AMZN, Strength 69.17, Position Size 118.00, Sector Technology
Symbol BA, Strength 63.07, Position Size 157.00, Sector Capital Goods
Symbol HIG, Strength 61.32, Position Size 120.00, Sector Financial
Symbol JNJ, Strength 60.98, Position Size 195.00, Sector Healthcare
Symbol TGT, Strength 60.12, Position Size 172.00, Sector Technology
Symbol CELG, Strength 60.12, Position Size 149.00, Sector Healthcare
Symbol FDX, Strength 57.87, Position Size 150.00, Sector Transportation
Symbol COF, Strength 57.71, Position Size 148.00, Sector Financial
Symbol BNI, Strength 56.37, Position Size 121.00, Sector Transportation
Symbol UTX, Strength 55.10, Position Size 171.00, Sector Conglomerates
Symbol BIIB, Strength 52.88, Position Size 178.00, Sector Healthcare
Symbol WMT, Strength 52.82, Position Size 191.00, Sector Technology
Symbol RIMM, Strength 51.60, Position Size 123.00, Sector Technology
Symbol CSCO, Strength 50.46, Position Size 459.00, Sector Technology
Symbol EOG, Strength 50.20, Position Size 77.00, Sector Energy
Symbol YHOO, Strength 49.28, Position Size 1.00, Sector Services
Symbol WLP, Strength 48.97, Position Size 211.00, Sector Financial
Symbol BBBY, Strength 48.72, Position Size 319.00, Sector Technology
Symbol IBM, Strength 48.70, Position Size 111.00, Sector Services
Symbol NYX, Strength 48.55, Position Size 217.00, Sector Financial
Symbol $INDU, Strength 48.46, Position Size 1.00, Sector
Symbol APOL, Strength 47.45, Position Size 118.00, Sector Technology
Symbol CAT, Strength 47.35, Position Size 192.00, Sector Capital Goods
Symbol NSC, Strength 46.95, Position Size 134.00, Sector Transportation
Symbol COST, Strength 45.92, Position Size 157.00, Sector Technology
Symbol DD, Strength 45.40, Position Size 249.00, Sector Basic Materials
Symbol JOYG, Strength 45.25, Position Size 167.00, Sector Capital Goods
Symbol BIG, Strength 45.24, Position Size 281.00, Sector Technology
Symbol GD, Strength 44.75, Position Size 153.00, Sector Capital Goods
Symbol HPQ, Strength 44.71, Position Size 233.00, Sector Technology
Symbol RRC, Strength 43.93, Position Size 136.00, Sector Energy
Symbol WFR, Strength 42.65, Position Size 203.00, Sector Technology
Symbol CNX, Strength 42.40, Position Size 120.00, Sector Energy
Symbol ESI, Strength 41.97, Position Size 102.00, Sector Technology
Symbol WHR, Strength 40.97, Position Size 121.00, Sector Consumer Cyclical
Symbol COH, Strength 38.58, Position Size 296.00, Sector Consumer Cyclical
Symbol EXM, Strength 38.00, Position Size 351.00, Sector Transportation
Symbol AAPL, Strength 36.79, Position Size 81.00, Sector Technology
Symbol SKF, Strength 34.33, Position Size 31.00, Sector
Symbol LVS, Strength 30.54, Position Size 223.00, Sector Services

Sorted !!
 

Attachments

  • TT_ALL.ELD
    28.6 KB · Views: 14
  • WorkSpaces.zip
    15.2 KB · Views: 12
Last edited:
Charlton - I presume you are in the US too, right ? Or are you nocturnal ?

Well done for passing the test & spotting my intentional mistake :whistling

I had to get a better sort routine in there.

In #TT_RATE_WEAKSTRONG I did this :
Code:
// Call a function to analyze the strength/weakness of a stock and produce a value
//RelativeStrength = getappinfo(aiRow);
RelativeStrength = RSI(Close, 14);

So now we'll be sorting by RSI just for testing purposes.

Then I found a decent array sorter & plugged it into TT_GET_ARRAY.

Code:
ReturnCode = TTsortD1basedOnD2key(RadarValues, NumElements,2,1,1);

New ELD attached. Workspaces are in the attached zip file (which is actually a rar file but T2Win won't let me upload rars :rolleyes: )

Out of trading hours, open workspace #PD_MACCI_RADAR first then open #PD_MACCI_CHARTS.

Lo & behold on the print log you will see...


Sorted !!
Pete

I am in the UK actually, but possibly nocturnal :devilish:

Again I am having a problem with downloading your files from T2W itself. A window opens up saying "Done" and that is it. Also if you try save target as. It just says it is a gif file called Clear.

Charlton
 
Pete

I am in the UK actually, but possibly nocturnal :devilish:

Again I am having a problem with downloading your files from T2W itself. A window opens up saying "Done" and that is it. Also if you try save target as. It just says it is a gif file called Clear.

Charlton

OK - try this....
 

Attachments

  • TT_ALL_ESL.ELD
    29.2 KB · Views: 19
OK - try this....

in that one the following is commented out on #TT_ENTRYPOINT..

//if LastBarOnChart then
// ReturnCode = TT_GET_ARRAY;

remove the comment to see the sorted list in the print output box
 
workspaces attached here if you want them...
 

Attachments

  • WorkSpaces.zip
    15.2 KB · Views: 19
I looked back through the prior posts in this thread as we now need to add a proper algorithm for sorting weak/strong stocks.

First suggestion was comparative strength. I put the code from the recommended Tradestation link (https://www.tradestation.com/Discussions/Topic_Archive.aspx?Topic_ID=22476) into our #TT_RATE_WEAKSTRONG

Code:
// This indicator calls a function which gives a strength rating
// it then calls TT_SET_ARRAY to store this strength rating in an 'array' of 
// global variables 
inputs: avglen(30); 

Vars : ReturnCode(0),RelativeStrength(0), relstrengthcomp(0),avgrelstrcomp(0), INDUClose(0),normalizevalue(0); 
// Call a function to analyze the strength/weakness of a stock and produce a value

// As $INDU is our baseline, we should store info on that in GVs
// Store Close of Indu or get it 


if GetSymbolName = "$INDU" then begin
	ReturnCode = GVSetNamedFloat("TTInduClose",Close);
	INDUClose = Close;
end
else
	INDUClose = GVGetNamedFloat("TTInduClose",1);

// if INDUClose isn't set yet - skip this. There's no guarantee $INDU will be processed first
// ... or is there ???

if INDUClose <> 1 then begin
if date <> date [1] or barnumber=1 or INDUClose[1] = 1 then
		normalizevalue = 1/(close/INDUClose); 
	relstrengthcomp = (close/INDUClose)*normalizevalue; 
	RelativeStrength = average(relstrengthcomp,avglen); 

// Now call a function to put this data away for use at trade time

	ReturnCode = TT_SET_ARRAY(RelativeStrength);

//Plot the relative strength

	Plot1(RelativeStrength,"Strength");
end;

I'm not publishing the ESL for this as it didn't quite work out the way I thought it would...

attachment.php


Is this a case of me having the incorrect algorithm for comparative strength or is comparative strength just not a great indicator ? Should I have not included the normalised code in there ?

Also - it was mentioned that we'd only check the last 30 minutes but the N Minute change checks the whole day. Any thoughts on that ?

Should we return to some ATR type of calculation or have I done somehting dumb with comparative strength ? Just the ranges of values it returns make it hard to pick the top 4 or 5 from 50 or so stocks....

Pete

PS - I was off line when I ran this so that may be the issue here. I'll run it again when I'm on-line back at the hotel. The company firewall here blocks access to the ports that TS uses.
 

Attachments

  • comparative.GIF
    comparative.GIF
    38.4 KB · Views: 158
Last edited:
http://www.trade2win.com/boards/technical-trader/8448-path-least-resistance-advanced-ta.html#post78402


We can use some kind of ATR trailing to measure pullbacks.

attachment.php


When the market is oversold and exhausted (1) and the stock is strong (2) and its pullback less than ~ 2 ATR (3) we will buy this stock.

This is also of interest
- from the linked thread I read that it's based on stocks hitting 52 week highs/lows. Is that right ?
- how do we reverse this to find weak stocks ???
- how do we turn this into an algorithm so we can code it ?

Cheers

Pete
 
OK - here's my radar with N Min Change with compression of 27 mins sorted by ATR

Next to that is the 30 min comparative.

Any thoughts on how we evaluate these ?

attachment.php
 

Attachments

  • comparative2.GIF
    comparative2.GIF
    62.4 KB · Views: 80
Top