Over the months Iraj has shown us how to use FINVIZ and N minute change to choose strong and weak stocks for both swing trading and intraday trading.
For programmed trading there are different approaches that could be used, and I am particularly thinking about intraday at present:
- Manually choose a basket of 3 or 4 strong stocks and 3 or 4 weak stocks. These would be input into the auto-trading engine at the start of the session and used throughout
- Automatically choose the 3 or 4 strongest/weakest stocks according to the prevailing market conditions i.e. the basket would be variable
We may decide to allow the auto-trading engine to allow both approaches (or have 2 similar engines).
The manual stock selection can be performed, at present, using the current tools.
For auto-stock selection there is a problem using N min change. This requires changing data compression during the session. I have been investigating whether it is possible to automate this. You can set up a macro to change data compression in a chart and it is possible to run a macro from within an indicator or showme, although I have done the latter. You cannot run a macro to change data compression in radar screen however.
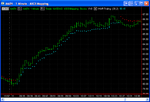
For this reason it is necessary to avoid the need to change data compression. For this reason I am proposing that we use a different function for automated strong/weak stock selection . One choice would be Comparative Relative Strength. This is the ratio of the change in price of the stock compared to market over a period.
StockFetcher: Comparative Relative Strength
We can build an indicator that performs this calculation from the market open to the current time and use a fixed 1 minute data compression.
If anyone has ideas for better measures of relative strength then please provide your suggestions.
Charlton
For programmed trading there are different approaches that could be used, and I am particularly thinking about intraday at present:
- Manually choose a basket of 3 or 4 strong stocks and 3 or 4 weak stocks. These would be input into the auto-trading engine at the start of the session and used throughout
- Automatically choose the 3 or 4 strongest/weakest stocks according to the prevailing market conditions i.e. the basket would be variable
We may decide to allow the auto-trading engine to allow both approaches (or have 2 similar engines).
The manual stock selection can be performed, at present, using the current tools.
For auto-stock selection there is a problem using N min change. This requires changing data compression during the session. I have been investigating whether it is possible to automate this. You can set up a macro to change data compression in a chart and it is possible to run a macro from within an indicator or showme, although I have done the latter. You cannot run a macro to change data compression in radar screen however.
For this reason it is necessary to avoid the need to change data compression. For this reason I am proposing that we use a different function for automated strong/weak stock selection . One choice would be Comparative Relative Strength. This is the ratio of the change in price of the stock compared to market over a period.
StockFetcher: Comparative Relative Strength
We can build an indicator that performs this calculation from the market open to the current time and use a fixed 1 minute data compression.
If anyone has ideas for better measures of relative strength then please provide your suggestions.
Charlton