Divergence Code For Day Traders

Grey1

Senior member
Messages
2,190
Likes
204
Divergence is a means of measuring the relative strength of the stock to the market, i.e market going down stock going up . In this case we say the stock has higher relative strength to the market. Under such a circumstances you would close your short position on the stock ( if you were short of course).

Down load the code , import your own set of stocks in it ,,also add $INDU . In the cell in front of $INDU right click and under the general tab check the UPDATE ON EVERY TICK .

You can use the above utility as follow

1) to exit your position in time ..
2) on daily data compression you can pick strong and weak stocks. ( if stock is strong then obviously donot short it )
3) if on your radar screen you get all your stocks showing WEAK this means stocks are not going to follow the market hence a reversal is imminent

Grey1

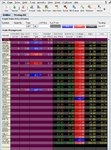
PS:-- this is the screen shot of the utility
 

Attachments

  • pic10.png
    pic10.png
    8.4 KB · Views: 307
Last edited:
Grey1 said:
Divergence is a means of measuring the relative strength of the stock to the market, That is market going up stock going down . In this case we say the stock has higher relativestrength r to the market. Under such a cirucmstances you would close your short postion on the stock ( if you were short of course).

Down load the code , import your own set of stocks in it ,,also add $INDU . In the cell infront of $INDU right click and under the general tab check the UPDATE ON EVERY TICK .

You can use the above utility as follow

1) to exit your postion in time ..
2) on daily data compressioin you can pick strong and weak stocks. ( if stock is strong then obviously donot short it )
3) if on your radar screen you get all your stock showiing WEAK this means stocks are not going to follow the market hence a reversal is imminent

Grey1

PS:-- this is the screen shot of the utility
Oppsssssssss T2W does not allow uploading of a TS file .. Sharky is there any way I could send you the code and you make it available for down load please ?

As i said i be back after 16 Sept to contribute more after my guests are gone..
 
Iraj,

You could post it as a text file which can then be imported into Easylanguage.


Paul
 
Trader333 said:
Iraj,

You could post it as a text file which can then be imported into Easylanguage.


Paul


The code carries 6 functions and 2 indicators . I think it is easier to have the complete code imported into TS than cut/paste it into a text file and then into TS ..

I am sure sharky can do it for us

grey1
 
Grey1 said:
The code carries 6 functions and 2 indicators . I think it is easier to have the complete code imported into TS than cut/paste it into a text file and then into TS ..

I am sure sharky can do it for us

grey1

Trader333 is going to make a web page where you all can down load the code from it .

Grey1
 
Iraj has kindly allowed me to setup a link to download the file. When you click on it then you should get an option to either save to disk or open it. Let me know if anyone has issues trying to download it.


Paul
 

Attachments

  • IRAJ DIVERGENCE.ELA
    7.8 KB · Views: 151
Last edited:
What is the best timeframe to use, or does it depend on what timeframe your trading?

Thanks
 
Grey1 said:
As i said i be back after 16 Sept to contribute more after my guests are gone..

Thanks for the code Grey1.

Very thin volumes the past couple of weeks, your normal trades would probably move the market at the moment. :LOL:

Trader333, thanks, the link worked a treat.
 
Last edited:
Trader333 said:
Iraj has kindly allowed me to setup a link to download the file. When you click on it then you should get an option to either save to disk or open it. Let me know if anyone has issues trying to download it.


Paul


Iraj File Click Here

My Goodness..God sent...

For a trending day like today I was thinking if only I could find a way of quickly finding the strong stocks so that an entry can be made when the Exh engine gives a signal with the price below the VWAP and then as long as the market maintains the strong trend, I can follow it up with a trailing stop. Thanks a lot Iraj and Paul- my wish for the day has come true :)

Regards

Raj
 
rajibde said:
My Goodness..God sent...

For a trending day like today I was thinking if only I could find a way of quickly finding the strong stocks so that an entry can be made when the Exh engine gives a signal with the price below the VWAP and then as long as the market maintains the strong trend, I can follow it up with a trailing stop. Thanks a lot Iraj and Paul- my wish for the day has come true :)

Regards

Raj

How to use the Utility ,

There is nothing more dangerous than shorting a strong stock or visa versa . Elementary TA teaches you this . The strength of stocks are defined by their reaction towards market movement .

a) DAILY

change the data compression to daily and get the list of weak/strong stocks . You can identify these stocks and short/buy them next day. ( you can change the INPUT value from default 2 to 1 for 1 day movements )

b) INTRA DAY

Use this on 5 min time frame with INPUT =1 then you can use it as EXIT Strategy along side with your exhaustion engine .

Stocks can change mode from WEAK to become STRONG depending on order flow .. This utility warns you when this happens and this is an awesome adge you gain .


Grey1
 
Last edited:
thank you Grey1 and Paul for your ever valuable insight and knowledge you have given us. this is a interesting way to look evaluating sectors and individual stocks. :)

much thanks
 
If there are traders on here that dont use Esignal as their datafeed then you may need to change the Dow index symbol in line with what it is called for your own datafeed.

As an example, IQ call this INDU.X and not $INDU (which is what Esignal call it). If you right click the indicator in Radarscreen (or format indicator if using a chart) you will have the option to change the name. In either case you will need to ensure that you do have the Dow index as a symbol you have added to RS or plotted on a chart.

Personally, I think this is a great tool and it is generous of Iraj to offer this to us so a big thank you from me and I am sure others also agree.:)


Paul
 
theknifemac said:
Is it just me or is the code password protected ?

Stew

Yes it is . I have actually paid for this code to be written by a third party firm and i would like to keep the rights to myself. you can how ever use it for your trading activity for free .


Grey1
 
HELP!

I can't get the divergence code to display anything. It always gives a reading of 0.0.
I just bought a copy of ts2000i recently and I'm still getting to grips on how to use it, so I'm probably doing something really stupid. But the code does import into TS and I'm able to insert the indicator on to a chart without any problems. It just always gives a reading of zero.

Any advice would be appreciated.

paulf.
 

Attachments

  • diverg.png
    diverg.png
    10.5 KB · Views: 136
paulf said:
HELP!

I can't get the divergence code to display anything. It always gives a reading of 0.0.
I just bought a copy of ts2000i recently and I'm still getting to grips on how to use it, so I'm probably doing something really stupid. But the code does import into TS and I'm able to insert the indicator on to a chart without any problems. It just always gives a reading of zero.

Any advice would be appreciated.

paulf.

Hi Paulf,

I am using the divergence code in the Radar screen - here you can expect it to give you indications of the stock being 'strong' or 'weak' in relation to the INDU. On a chart you can anyway see if the stock price is in divergence or not by comparing it to the INDU chart. Try using it on the RS with the settings, as mentioned by Grey1 to get the signals.

Raj
 
Thanks Raj

I've tried it in Radarscreen and I'm getting some readings.
I'm just looking at historical EOD data at the moment but its working fine.

I really need to get up to speed with 2000i.

Appreciate your help Raj.

BTW Thanks for sharing the code Grey1.
 
Hi Grey1

Many thanks for sharing the codes. On my RS, i have Red color Weak and Magenta color Weak.

As for strong, there are also two colors, cyan and green.

Is there any special meaning?

regards,
 
Last edited:
leovirgo said:
Hi Grey1

Many thanks for sharing the codes. On my RS, i have Red color Weak and Magenta color Weak.

As for strong, there are also two colors, cyan and green.

Is there any special meaning?

regards,

Red and green are NEW signal ...

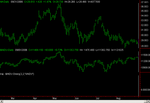
I shorted JOYG based on sea of divergence as shown below @ 18.51.. Thisis how you should read the market direction
 

Attachments

  • pic11.png
    pic11.png
    8.4 KB · Views: 186
  • 1251.jpg
    1251.jpg
    472 KB · Views: 146
Grey1 said:
Red and green are NEW signal ...

I shorted JOYG based on sea of divergence as shown below @ 18.51.. Thisis how you should read the market direction

thanks for explanation about colors.
I am not sure what you mean by sea of divergence, all I can see is weak signals across the board except JOYG. Does it mean JOYG is neutral and right choice for shorting when Dow is OB? ( At 18.51, Dow OB and JOYG nearly OB and macci cycle turning down. )
 
Top