You are using an out of date browser. It may not display this or other websites correctly.
You should upgrade or use an alternative browser.
You should upgrade or use an alternative browser.
A question on optimization for anybody with some knowledge of these matters.
Supposing I wanted to optimize a portfolio of say 15 stocks for some objective function such as Sharpe ratio, where the 15 stocks are chosen from a universe of something like 100 - 200 stocks, what would be a suitable technique ? Restating the problem, I want to choose 15 stocks from 100 such that the sharpe ratio of the portfiolio is highest.
This is a combinatorial problem and linear searches will take a long time. Maybe a GA might be adapted to this ?
Yes, I realise that there are a lot of degrees of freedom and the consequences of that.
And now for something a bit different. The Motley Fool has a "game" called CAPS where members rate a stock on a scale of 1 to 5. There are about 100K members, and about 2M stock ratings. There is a stock screener with CAPS ratings and some conventional fundamentals. The home page is here:
Stock Research | Stock Picks - Motley Fool CAPS
Working on the assumption that the "players" are probably no worse than a lot of wall street analyists and there may be some collective wisdom at work, I thought it may be worth having a bit of a look at. So I integrated the CAPS ratings into my own screener and looked at the affect of only including stocks with CAPS 4-5 in long screens discussed on this thread and stocks with CAPS ratings of 1-2 in short screens.
The interesting thing is that in no cases did the CAPS rating make existing screens worse, and in most cases it improved them. They seem to have the nice property of automatically eliminating stocks that might otherwise ruin your day.
It's early days yet, and I've not been able to get historical download of CAPS ratings to work properly (there seems to be a bug in their screener), but it is something that I will continue to track. If nothing else, it seems that it is some sort of measure of retail investor sentiment towards individual stocks.
Grey1
Senior member
- Messages
- 2,190
- Likes
- 210
And now for something a bit different. The Motley Fool has a "game" called CAPS where members rate a stock on a scale of 1 to 5. There are about 100K members, and about 2M stock ratings. There is a stock screener with CAPS ratings and some conventional fundamentals. The home page is here:
Stock Research | Stock Picks - Motley Fool CAPS
Working on the assumption that the "players" are probably no worse than a lot of wall street analyists and there may be some collective wisdom at work, I thought it may be worth having a bit of a look at. So I integrated the CAPS ratings into my own screener and looked at the affect of only including stocks with CAPS 4-5 in long screens discussed on this thread and stocks with CAPS ratings of 1-2 in short screens.
The interesting thing is that in no cases did the CAPS rating make existing screens worse, and in most cases it improved them. They seem to have the nice property of automatically eliminating stocks that might otherwise ruin your day.
It's early days yet, and I've not been able to get historical download of CAPS ratings to work properly (there seems to be a bug in their screener), but it is something that I will continue to track. If nothing else, it seems that it is some sort of measure of retail investor sentiment towards individual stocks.
Very good work ,,
grey1
Thanks Grey,
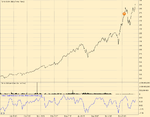
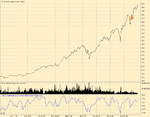
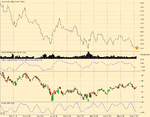
The more I look at this, the more interesting it gets. I ran a screen for CAPS rating 1 stocks and CAPS rating 5 stocks on the constituents of the SPX. There are 40 stocks with rating 1 and 77 with rating 5. The results are shown below. A couple of warnings about these results:
1. My SPX constituents list is a bit out of date, but I don't think that matters much.
2. The ratings are of yesterday and we are applying "future knowledge" in this test. However the ratings tend to be fairly static over time and are presumably based mostly on fundamentals. I've spot checked a number of stocks and the ratings really don't change much. (If the historical downloader worked properly, I could be a bit more rigorous with some backtesting.)
Attachments
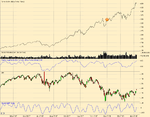
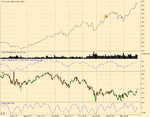
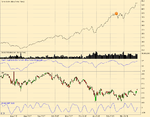
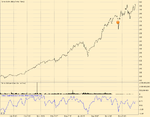
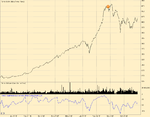
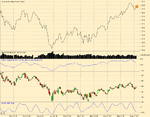
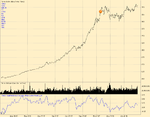
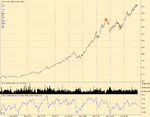
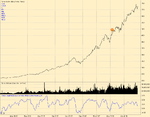
An important issue with high relative strength stocks is "How risky are they ?" - what happens when the tide goes out ? Conventional wisdom suggest that they are very risky, but as so often in trading, conventional wisdom is not necessarily especially wise. Here are the results from a long screen performed on the first of each month starting from dec '07. The screened tickers are listed on the left of each chart.
But first here is the trace output by my screener showing the steps. The steps are more or less self evident. The PCR (Operations -Qtr) is the ratio of market cap to cash flow from operations - Price Cashflow Ratio. The dec and jan screens omit the Insider holdings filter as I don't have the data.
But first here is the trace output by my screener showing the steps. The steps are more or less self evident. The PCR (Operations -Qtr) is the ratio of market cap to cash flow from operations - Price Cashflow Ratio. The dec and jan screens omit the Insider holdings filter as I don't have the data.
Code:
01 Feb 2008 Filter. Technical Screen: close > 5.0;
01 Feb 2008 Filter. Technical Screen: decent dollar volume 2;
01 Feb 2008 Filter. Technical Sort: sharpe250; Descending; Preserve Sectors; TOP 100
01 Feb 2008 Filter. Technical Sort: sharpe65; Descending; Preserve Sectors; TOP 50
01 Feb 2008 Filter. Fundamental Screen: Yahoo Finance PCR (Operations - Qtr) GREATER_THAN 0.0; Preserve Sectors
01 Feb 2008 Filter. Fundamental Sort: Yahoo Finance Price/Sales (ttm) Ascending; Preserve Sectors; TOP 13
01 Feb 2008 Filter. Fundamental Sort: Yahoo Finance % Held by Insiders Descending; Preserve Sectors; TOP 9
Last edited:
Similar threads
- Replies
- 0
- Views
- 5K
- Replies
- 0
- Views
- 4K
- Replies
- 8
- Views
- 2K

