Hi,
I am a bit confused about the weak/strong lists of stocks used. My understanding is that Iraj trades a special list using fundamental data and then applies technicals. But then I have seen lists of strong weak stocks that are based solely upon the MACCI on the 10 min $INDU chart 😕
However what about the other guys such as vegas and fibbo who have been on the mentoring with Iraj? Are they just using the MACCI and $INDU 10 min or using fundamentals as well?
Would appreciate any info from people using the strong/weak MACCI strategy.
Regards,
Imran
hi Imran,
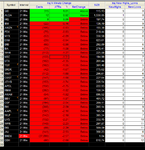
i believe the list of stocks featured on this thread are suitable for intraday scalping
and the code on this thread should be used to identify which are strong/weak on a certain day, for day trading ( based on Greys 1st post on this thread)
Grey's fundamentally weak lists are listed of my swing thread, these i believe, should be used to swing trade, with cycles, based on MACCI daily's for O/S O/B conditions (and 10min MACCI charts used to pin point entries on day of chosen entry)
hope this helps
glen