You are using an out of date browser. It may not display this or other websites correctly.
You should upgrade or use an alternative browser.
You should upgrade or use an alternative browser.
Wallstreet1928 Analysis & live calls on FTSE,DAX,S&P...aimed to help New traders
- Thread starter wallstreet1928
- Start date
- Watchers 252
- Status
- Not open for further replies.
SuddenDeath
Legendary member
- Messages
- 14,063
- Likes
- 143
since 10th july, wo consecutive down days seems ..
... the most we get, thats what the guy from inthemoneystocks video says, so today in theory should be followed by an upday
SD: how are you? what's your view for today?
... the most we get, thats what the guy from inthemoneystocks video says, so today in theory should be followed by an upday
sujithsstorock
Veteren member
- Messages
- 4,236
- Likes
- 42
free call
FREE CALLS>>sell silver at 14.97 sl 15.10 tgt 14.72
sell eur/usd at 14260 sl 14290 tgt 14218-14150
rest given to clients
FREE CALLS>>sell silver at 14.97 sl 15.10 tgt 14.72
sell eur/usd at 14260 sl 14290 tgt 14218-14150
rest given to clients
london_lad
Established member
- Messages
- 675
- Likes
- 1
s&P came worse than expected.
Hi Splitlink,
Your chart is looking at shorter timeframes. I normally combine Fib with time cycles. In the chart I showed earlier we go 2/3 days down and then we hit a fib level > good chance we bounce off it.
The problem with fibs is like you say how do you know which one to take? There is not an easy answr for this. It depends on market state (choppy or trending), elliot wave structure etc. Can be a study in itself.
The one thing I think could help a lot of people here is to look at larger timeframes and plot fib lines from there. That could give you good points where a market might turn or halt on a day.
Hope this helps (probably not much?)
papak
Hope this helps (probably not much?)
Please don't say that! I'll have to pay closer attention to your post,later. Thanks a lot
I've spent a fair amount of time studying Fibs and had discarded them, but I saw your post. I'll do as you suggest and look at other time frames.
london_lad
Established member
- Messages
- 675
- Likes
- 1
I meant ADP.
blix: I expect better ISM numbers and as mentioned in earlier post. Whenevr futures indicate a lower open (ie, out of hours decline), at the US open they rush upwards even if its temporary.
is this right does this happen how long have you seen this happen london lad
is this right does this happen how long have you seen this happen london lad
rah it worked today
london_lad
Established member
- Messages
- 675
- Likes
- 1
Yep it did and I exited my position with 10 points profit. I averaged my long of 4804 at 4779.
london_lad
Established member
- Messages
- 675
- Likes
- 1
I am looking to go long again at 4790 region.
london_lad
Established member
- Messages
- 675
- Likes
- 1
5MACD system would've worked great today. I thnk, everytime you see VIX above 28, you should use this strategy. I know, I will.
http://www.trade2win.com/boards/general-trading-chat/38906-ftse-trading-system-advice.html
http://www.trade2win.com/boards/general-trading-chat/38906-ftse-trading-system-advice.html
london_lad
Established member
- Messages
- 675
- Likes
- 1
short at 4811
Dentalfloss
Legendary member
- Messages
- 63,404
- Likes
- 3,726
1600 is the new pivot
5 min data

5 min data
Dentalfloss
Legendary member
- Messages
- 63,404
- Likes
- 3,726
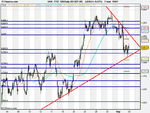
s500
could be starting a mini bull swing
5 min data

needs to break above 1002 for the upper price target to be active of 1014
could be starting a mini bull swing
5 min data
needs to break above 1002 for the upper price target to be active of 1014
london_lad
Established member
- Messages
- 675
- Likes
- 1
Dentist: 997 is current price. Way down the uptrend of blue line. What makes you think it will be bullish? retracement?
Dentalfloss
Legendary member
- Messages
- 63,404
- Likes
- 3,726
PHP:
Dentist: 997 is current price. Way down the uptrend of blue line. What makes you think it will be bullish? retracement?
looking like a base forming
Dentalfloss
Legendary member
- Messages
- 63,404
- Likes
- 3,726
the last signal was a double-top breakout.that makes the chart bullish
the last column of "x" s is the anchor column...possibly
if it breaks above this column.the price target is active
if you look at the chart,we had a succession of double- bottoms.then the last signal was a double-top
so the chart maybe getting bullish
the last column of "x" s is the anchor column...possibly
if it breaks above this column.the price target is active
if you look at the chart,we had a succession of double- bottoms.then the last signal was a double-top
so the chart maybe getting bullish
Dentalfloss
Legendary member
- Messages
- 63,404
- Likes
- 3,726
if it breaks below 992,then the whole bullish scenario is void
so we watch that range
hope this explains it
so we watch that range
hope this explains it
wallstreet1928
Legendary member
- Messages
- 6,609
- Likes
- 89
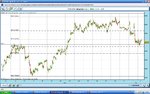
is it just me, or is that a double bottom on the FTSE today?
bit of bullish osc div on there too.
yes my friend but also double top @ 4816
BP ruled the roost today
oil sector showed strength as soon as the BP news came out otherwise this market would have been hammered with oil price skidding to $67
Attachments
- Status
- Not open for further replies.
Similar threads
- Replies
- 72
- Views
- 21K
- Replies
- 21
- Views
- 8K