london_lad
Established member
- Messages
- 675
- Likes
- 1
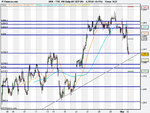
4782ish is silly support region. Let it break 4783, then next is 475something target.
FTSE chart ............
bounce @ 4785
previous resistance now = support
Euro data @ 10am could also give a lift
support on
BP @ 515
BHP billiton @1490 -1520 region
barc @ 355
mks @ 336 - 338
DAX also has support @ 5250 -5270 region
oil has support @ 67.8 region
EURO holding up well
I will certainly short again after enjoying the little rise upto 4800 ....
I will look to short at gap down level 4815 .........stop loss 4840
target 4760 -4740
pound jumping after PMI data
I am now short 4810 ...stop loss 4835
sorry gap down level was 4808
I am now short 4810 ...stop loss 4835
sorry gap down level was 4808
In the ideal world of time cycles the market should pause / retrace a bit for 1 or 2 days before going further down. I will probably stay on the sidelinest and watch price action.
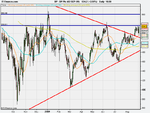
SP500 has retraced 61% of last upmove in 2 days! See chart. Break of 17 Aug low will mean the whole rally is over and we crash down again.
FTSE only retraced not even 50%, 13 Aug resistance turned support (see chart) so FTSE has some catching up to do..
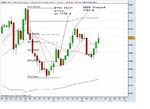
This morning I was a bit too clever for my own good and got stopped out of a short trade by trading, what I thought was, a pullback.
So I have been thinking about Fib lines in trading and have reproduced what I did and included Fib lines, although I was not using them, at the time
Noticing your charts, I am including my own trading for this morning and would like your view (and anyone else's) on what I did. To put it bluntly, my stop was too close, although I have a low tolerance for stops that are too far away. That happens. 🙁 but how could Fibs have got me out of trouble, please?
Would anyone care to show me how I could have, successfully, entered a short position by using them?
It seems to me with Fibs, that the 38% and the 80% were valid turning points. How to tell which one?