Wallstreet1928 Analysis & live calls on FTSE,DAX,S&P...aimed to help New traders

Status
Not open for further replies.
analysis of market leading stocks

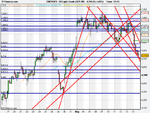
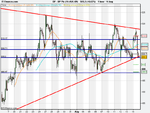
Barclays - bearish ....failed double top @ 366 .....support @ 354, 350 , 337

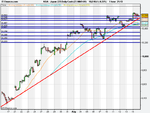
Anglo American - bullish ....uptrend still intact...higher highs,higher lows..fall below 1900 and I will become bearish


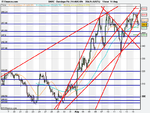
BP -neutral posture.... range bound between 500 - 520.......just keep playing that range as a day trader

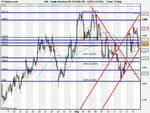
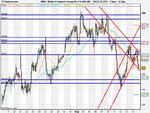
Marks and sparks - bearish...bear flag scenario ...I will look to short this stock on any rise ...target 326
 

Attachments

  • Barclays Plc (14-AUG-09).png
    Barclays Plc (14-AUG-09).png
    26 KB · Views: 123
  • Anglo American Plc (14-AUG-09).png
    Anglo American Plc (14-AUG-09).png
    24.4 KB · Views: 121
  • BP Plc (14-AUG-09).png
    BP Plc (14-AUG-09).png
    19.9 KB · Views: 117
  • Marks & Spencer Group Plc (14-AUG-09).png
    Marks & Spencer Group Plc (14-AUG-09).png
    23.1 KB · Views: 128
Last edited:
us oil ...............

key level $67.15...gap fill support

Euro recovered late friday so i expect to buy oil with target of $68 and $68.8

stop loss $67

Japan GDP could cause it to go either way so I will wait for confirmation post data
 

Attachments

  • US Light Crude (SEP-09).png
    US Light Crude (SEP-09).png
    24.7 KB · Views: 116
Last edited:
the asian session will give an early signal

can Nikkei break through 10, 600
 

Attachments

  • Japan 225 Daily Cash (23-MAR-09).png
    Japan 225 Daily Cash (23-MAR-09).png
    17.9 KB · Views: 107
Asia/Pacific Last Trade Change Related Information
^AORD All Ordinaries (Australia) 4,402.80 6:00am -62.30 (-1.40%) Chart, Components, more...
^BSESN BSE 30 (India) 15,032.88 6:11am -378.75 (-2.46%) Chart, more...
^HSI Hang Seng (Hong Kong) 20,340.85 6:05am -552.48 (-2.64%) Chart, Components, more...
^JKSE Jakarta Composite (Indonesia) 2,386.86 14 Aug -9.62 (-0.40%) Chart, Components, more...
^KLSE KLSE Composite (Malaysia) 1,188.57 14 Aug 2.38 (+0.20%) Chart, Components, more...
^NZ50 NZSE 50 (New Zealand) 3,086.08 5:31am -65.17 (-2.07%) Chart, Components, more...
^N225 Nikkei 225 (Japan) 10,287.90 6:00am -309.43 (-2.92%) Chart, more...
^NSEI S&P CNX NIFTY (India) 4,468.75 6:21am -111.30 (-2.43%) Chart, more...
^KS11 Seoul Composite (South Korea) 1,547.06 6:01am -44.35 (-2.79%) Chart, Components, more...
000001.SS Shanghai Composite (China) 2,890.39 6:05am -156.58 (-5.14%) Chart, Components, more...
^STI Strait Times (Singapore) 2,571.29 6:20am -42.89 (-1.64%) Chart, Components, m
 
Technical Question

Morning Gents, looks like a possible selloff today.
Question on Pivot points.
I know there has been questions before, but I have applied the following to obtain pivot points with IG Real time charts and compared the result with another web site and the values differ.
The settings are:
Select Display Intraday Charts from 08.00 to 16.30 and Set Time Zone GMT.
This displays Pivot =6723, R1 = 4735, R2 = 4743, S1 = 4714, S2 = 4702.
Are these correct, if not what settings should I use when using a 10 min timeframe ?
 
Been trying MACD convergence strat on 10 min chart. Short all times, it worked twice and failed once. Still +ve in bank.
 
a new short signal on the daily.however,could be a bear trap
indecision at this point in time from this chart

1z6b02s.jpg
 
Market is very tightly rangebound. It has lost a lot of pips today since open. My guess is that it will reel back to average daily range.
 
Status
Not open for further replies.
Back
Top