Dentalfloss
Legendary member
- Messages
- 63,404
- Likes
- 3,726
Re: Wallstreet1928 Analysis & live calls on FTSE,DAX,S&P...aimed to help New traders
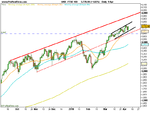
this is the way to do it,if want to use ichimoku for scanning.it is free aswell
prorealtime.com
a normal candle chart,say weekly.colour fill the candles with bright colours so you can see them very easily.then click on indecators.use ichimoku on price.the lines will come up,but not the cloud
now here is the trick.......go to colour zones and click on the cloud lines.the space between the lines will fill with colour.make the fill bright,to stand out
the charts are nearly right.there are a few discrepancies with netdania and stockcharts,but not a real problem,as all you are looking for at this poi nt is the general feel
the one thing about prorealtime is that it does not project the cloud .ie give you the forecast of s/r areas.i will write the adjustment for this when i get time and post it.but at this point ,you dont really need it.
all i am looking for is
1.price about to cross cloud from below.ie chart getting bullish
2.price crossing from above..ie getting bearish
3.price above..a good uptrend established
4.price below a good downtrend established
then make up a watchlist.and start to look harder.
they have ftse top 200 stocks.you can scan these in under 10 minutes.then make a rough note of how many are outright bullish or vice versaa bearish.this gives you an idea of market breadth