blix, ive just read up on RSI div etc.
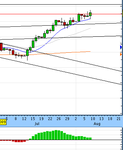
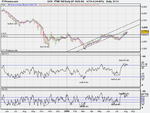
check this chart out, ftse daily (up to date)
this is a bearish divergence isnt it? (with price and RSI)
i have drawn the trend lines on price chart and rsi...
higher highs on price.
Yet almost level RSI..actually its slightly lower....75 to 73
level rsi is a bearish sign, as is the lower highs on RSI.
Please confirm if i am talking sense.
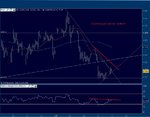
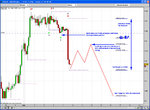
This signal is even more pronounced with the 5 period RSI.
I have used 14 RSI in the chart attached.
yeah that's bearish osc div jonboy. i use the 14 period, i have no experience of using a shorter period RSI, other than SD's 5RSI, 5stochastic, 10TF system.
so whilst learning, i'd stick to the 14 RSI to study divergence.
i don't use RSI as an 'overbought/oversold' indicator, as i think momentum indicators used in this way are not that helpful, especially when you're starting out using them. i'd just stick to using it for divergence. on a daily TF it can be pretty handy for trying to asses where a market might be headed (or at least if a current trend is starting to run out of steam).
as i'd said, i'd ditch the MACD right now. leave the RSI on and just study divergence for a month or two. after a while osc div tends to jump out at you straight away. when you feel this has happened, then move on to add another indicator to study/asses if you feel you need to.
remember though, MACD, stochastic, RSI are all momentum indicators, unless you have a good reason (ie it's part of your system), there's no real point in having more than one, as ideally you want at least 3 NON CORRELATING indicators ie, momentum, volume, sentiment. the idea being that once you have 'permissions' from each non correlated indicator, you've raised the probability of a positive outcome.
remember though, some people use no indicators at all, as, with a huge amount of experience, some traders see all the information they need in price action alone.
these people are joking referred to as being on the 'dark side', maybe in time we'll all end up there, but personally i think you have to go through the process of learning a lot of this stuff to potentially realise that you may not need it!