wallstreet1928
Legendary member
- Messages
- 6,609
- Likes
- 89
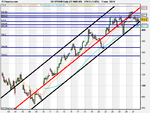
S&P weekend analysis
1 month 1 hr chart
well , well , what do we have here?
Black trend line - do we have a possibility of a breakout? hmmmmmmm............
I suspect so ............but lets allow the market to tell us that, before we start to trade what we think!!!
blue horizontal trend line at 816 vital for me, if taken out then next level will be 806 and it could be a violent move even further southwards
i will post chart soon
teething problems
Hi Guys,
I agree with you on this WS.
Here's my analysis:
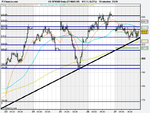
I would be looking for an opportunity to short the SPY possibly at 8130 depending on the candlestick. Reasons are because my support line at 8150/8135 has already been tested 3 times and is now weakened which also coincides with March 25th open and close value 8135. Trend support line also been tested 3 times and is weakened. If there is a break I would be looking to profit at 8060 touching the MA50 on the 60min chart and also touching a key support line from the close of 24th March and being a resistence level Mid trading day of 23th March.
Let's see what happens could go either way but won't know until the day. Hope this is a sound analysis but have been working with what time I have recently. I can trade the US markets after work if there are any opportunites.
Have also been doing some reading up and will only take a max of 3-5 trades a day, if 3 losses in a row stop trading for the day and stay on the sidelines. Also keep to minimum stake until I am consistent.
Vikash
P.S. Anyone watch the daily politics show this morning, there was a spreadbetting millionaire on today.... inspiring..... 👍
good analysis my friend
I have been busy playing cricket this morning and now I am off to play squash
I have updated charts on S&P analysis
and unfortunately i didn't get a chance to watch the politics show
millionaire????!!! - I am happy with the little profit i make but i suppose you do have a point about inspiration
Hi vicks, do you have a link to that show.. couldnt find it on bbc iplayer anywhere?Hi Guys,
I agree with you on this WS.
Here's my analysis:
I would be looking for an opportunity to short the SPY possibly at 8130 depending on the candlestick. Reasons are because my support line at 8150/8135 has already been tested 3 times and is now weakened which also coincides with March 25th open and close value 8135. Trend support line also been tested 3 times and is weakened. If there is a break I would be looking to profit at 8060 touching the MA50 on the 60min chart and also touching a key support line from the close of 24th March and being a resistence level Mid trading day of 23th March.
Let's see what happens could go either way but won't know until the day. Hope this is a sound analysis but have been working with what time I have recently. I can trade the US markets after work if there are any opportunites.
Have also been doing some reading up and will only take a max of 3-5 trades a day, if 3 losses in a row stop trading for the day and stay on the sidelines. Also keep to minimum stake until I am consistent.
Vikash
P.S. Anyone watch the daily politics show this morning, there was a spreadbetting millionaire on today.... inspiring..... 👍
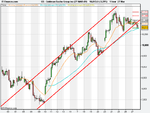
something to mull over here guys
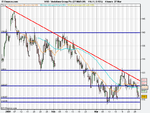
Has Goldman Sachs the market leader for financials broken out of its up trend????????
If it has it will impact the financials across the pond, if USA sneezes we catch pneumonia ?
which means financials going down
Leader of the Telecoms sector, Vodafone is looking weak (i shall post chart of this )
Telecoms sector going down
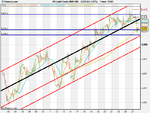
Do we have a failure of oil breaking above $55
oil could come back to $51.2 in the near term
black line on chart was key for me when trading last week when I was shorting oil
oil down = oil stocks down, which are heavily weighted on FTSE
Rio tinto - mining sector leader in my eyes and its looking top heavy 2500 was the resistance as i pointed out in my chart on friday(when I was long on this stock all the way up to 2500)
overall summation = Bias is on the down side chaps
oil and gas = 21.2%
financials = 19.94 %
telecoms = 7.9 %
If we can work out what 50% of the market is doing, I think we will have a good idea of where the market is headed.
http://www.ftse.com/Indices/UK_Indices/Downloads/FTSE_100_Index_Factsheet.pdf
lets go looking for shorts
If anyone is interested I have opened up a long on Gold due to the reasons given above along with my chart analysis
big fall in nikkei overnight
nikkei down 4.4%
hang seng 3%
seoul 3.24%
singapore 3.87%
australia only down 1.7%