wallstreet.
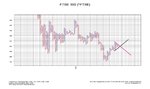
i dont think the chart is a good one, you displayed for the readers.
they are not getting the true picture of the price action.i am posting ,that gives a general veiw.please correct me if you think it is wrong
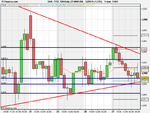
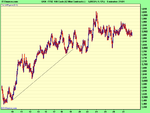
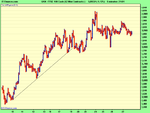
this chart is 5 min data for 1 month.you can see the price going up and is now in a flat zone,with no real direction.just bouncing between 3800 and 4000.there are a couple of s/r zones as wallstreet pointed out.
to readers.pay little attention to chart formations.just look at the general picture
there are a few wild moves,which distorts the general picture,within the consolidation zone
hope this helps
guzel,guzel