SuddenDeath
Legendary member
- Messages
- 14,063
- Likes
- 143
It would be great to find a website which identified news releases likely to cause sharp moves in markets
Nice call by the way Dr B - did you trade the short?
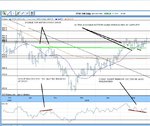
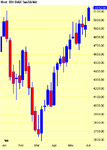
Ah ok. Where you have the recent double bottom, I believe thats a double top instead, as I think a bottom has to be at the bottom of a downtrend, a top is at the top of an uptrend. I reckon its a double (and possibly becoming triple) top at the moment.
Theres some good info on patterns and stuff here: StockCharts.com - ChartSchool - Chart Analysis
interesting leo, i didn't know that about bottoms/tops, i thought they could appear anywhere! 😱
what about this?
Rectangles
i'm not being contrary just for the sake of it btw! it's just that i want a drop badly, but i'm trying to be really objective about the possibility.
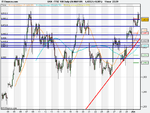
FTSE 100 , 1 yr daily
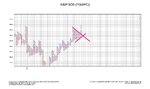
I will go long on Monday up to 3512
wait to see if there is any resistance in that area and then go long or short accordingly
will we reach 4680 level?