Hi Petar, great work
Just looking at your recent EUR/NZD short. I know this is after the event but it will give you an idea of how I look at things.
EUR/NZD (Based on my MT4 data feed)
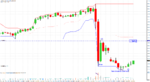
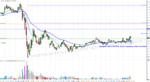
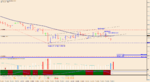
Daily chart:
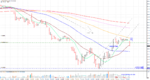
In a good down trend with 9 June taking out monthly lows.
21 June closed at a new year low but more importantly took out Dec 2015 low. The volume did not increase at these levels as I would have expected defence or breakout activity. Down trend at risk.
22 June even less volume, the day before Brexit vote so understandable.
23 June a push down on increasing volume.
24 June Massive volume, 2nd highest of the year, as Brexit result released. The candle did close downd but well off its low and the range was not directional.
Going into 27 June: based on daily analysis, downd trend has come to rest. Sideways or pull back likely.
The 24 June needs to be looked at in more detail for clues.
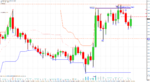
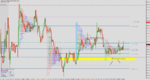
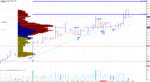
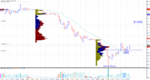
4 hour chart: (bad time frame for analysis as brokers use different settings) The second candle of the day had the highest volume but gave no direction. It did close up and so did the following one; buyers!
The 4th candle of the day had the biggest range and closed down into new lows BUT the volume was less than the prior two candles. Last bar of the day was no supply.
Going into 27 June: based on combination of daily and 4 hour analysis, supply gone or going and buyers entering the market.
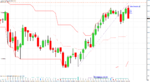
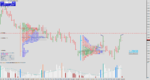
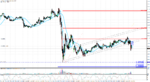
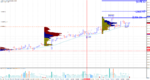
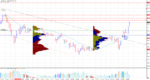
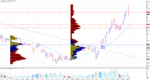
24 June, 1 hour chart; early morning chaos followed by a directional move down to new lows. The high volume at these lows resulted in price moving up, buyers!
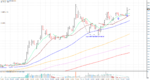
So how to trade 27 June: I don't see strong supply and the downward trend momentum is dying. Looking around the time you went short, I don't see any good reason to go long. At that point in time, sideways would have been my guess; no trade.
Just looking at your recent EUR/NZD short. I know this is after the event but it will give you an idea of how I look at things.
EUR/NZD (Based on my MT4 data feed)
Daily chart:
In a good down trend with 9 June taking out monthly lows.
21 June closed at a new year low but more importantly took out Dec 2015 low. The volume did not increase at these levels as I would have expected defence or breakout activity. Down trend at risk.
22 June even less volume, the day before Brexit vote so understandable.
23 June a push down on increasing volume.
24 June Massive volume, 2nd highest of the year, as Brexit result released. The candle did close downd but well off its low and the range was not directional.
Going into 27 June: based on daily analysis, downd trend has come to rest. Sideways or pull back likely.
The 24 June needs to be looked at in more detail for clues.
4 hour chart: (bad time frame for analysis as brokers use different settings) The second candle of the day had the highest volume but gave no direction. It did close up and so did the following one; buyers!
The 4th candle of the day had the biggest range and closed down into new lows BUT the volume was less than the prior two candles. Last bar of the day was no supply.
Going into 27 June: based on combination of daily and 4 hour analysis, supply gone or going and buyers entering the market.
24 June, 1 hour chart; early morning chaos followed by a directional move down to new lows. The high volume at these lows resulted in price moving up, buyers!
So how to trade 27 June: I don't see strong supply and the downward trend momentum is dying. Looking around the time you went short, I don't see any good reason to go long. At that point in time, sideways would have been my guess; no trade.