Petar Jacimovic
Active member
- Messages
- 195
- Likes
- 2
Hello traders,
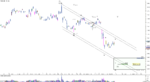
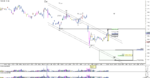
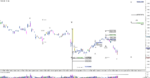
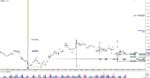
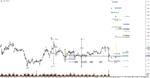
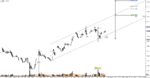
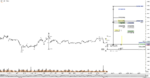
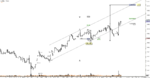
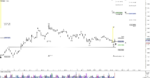
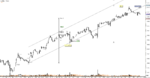
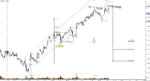
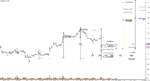
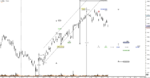
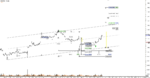
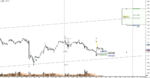
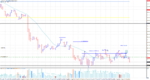
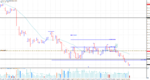
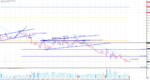
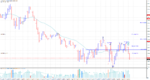
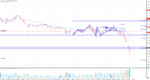
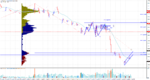
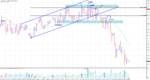
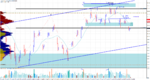
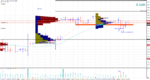
On the request of readers, I will include Elliot Wave counting together with volume analysis to find best opportunities on the market. I am starting with my USD/CAD short at 1.3051. USD/CAD started major re-selling from long-term investors. In 15M time frame, I found interesting development and I expect good selling opportunities on this currency pair this week.
Strong supply entered the market in a heavy volume from the top. USD/CAD is in progress to form first 5 wave counting, which will confirm changing in trend dynamic from bullish to bearish. My SL is at 1.3080 and target zone at 1.2970-1.2940-1.2915.
Best Regards,
Petar