Petar Jacimovic
Active member
- Messages
- 195
- Likes
- 2
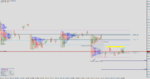
I am still building buying. This time, this looks like much better entry.
I am bullish from 1.3310 Risk about 60-60 pips and going for at least 150-300 pips >
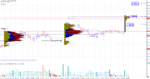
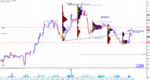
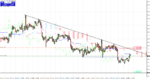
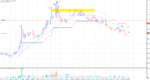
Bullish on EUR/NZD. I found massive demand after the CPI report in New Zealand. The price went to test FR 61.8% and stopped there. I am bullish from 1.5570. The final target is set at the price of 1.5800.
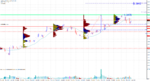
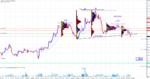
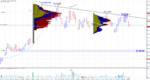
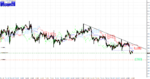
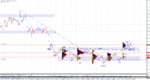
I am very bearish on GBP/USD from 1.3175.I found a massive weakness in the background (buying climax and very wide spread of the bar). There is also HSS formation from the top and the price broke the neckline. My target is set at the price of 1.2850. I am risking about 50 pips in this setup, which means that I am going for 1:6 RRR. Of course, I will follow price action and close before setup if is needed.
Feel free to comment if you like analysis 🙂
Someone really wants to sell off this pair, let's see what will happen
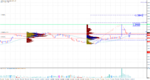
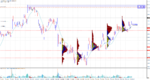
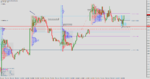
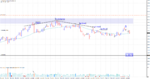
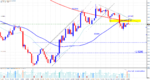
Took short on EUR/USD. This is simple trend trade together with Ichimoku. I found rejection from turn line and I will try to take 1:2RRR in this setup.
Sold EUR/USD at 1.1085 intraday >
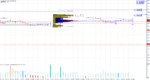
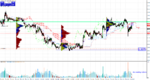
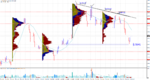
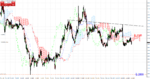
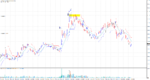
I used M3 in this analysis >
I marked letters on the chart >
a - Buying climax , first potential sign of weakness
b - Ultra high volume up bar closed in the middle (this must be a sign of weakness)
c - Up-thrust in an ultra high volume. This is a sign that sellers are on the market and that we may see potential distribution phase.
d - Another buying climax into the high new ground. Notice that bar closed weak even below the middle, which is strong sign of weakness
e - No demand bar. Volume lowers compared with previous 2 bars. The spread of the bar also lower.
f - after we sign strong signs of weakness in the background and the price also went below 21SMA, this is a good sell bar.
SL is around 15 pips but I will try to take at least 45 pips. Will see the price action and manage my position...
If you like analysis feel free to comment >