Volume analysis – The Key to the Truth

Hello traders,
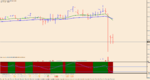
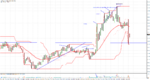
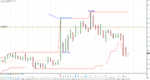
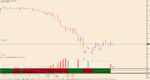
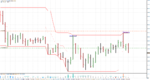
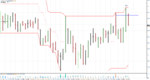
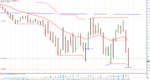
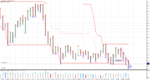
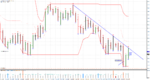
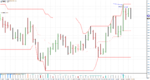
It was obvious that smart money pre-positioned before the news. I wasn't near the computer for this news but from the daily price action, I saw that they already sold before the actual release. Missed this one but I am waiting next week for big news releases

Petar
 

Attachments

  • USDCADM15.png10.png
    USDCADM15.png10.png
    51.1 KB · Views: 197
Interesting development on EUR/USD according to the daily time frame. I can see massive cluster there and the price respected very well that cluster. Also, I found a bearish engulfing pattern and buying climax in the background. I am bearish on EUR/USD according to the short-term prospective.

Objective targets are set at 1.1090 , 1.0900 and 1.0580

Petar
 

Attachments

  • EURUSDDaily.png10.png
    EURUSDDaily.png10.png
    152 KB · Views: 247
Hello Petar

I have some questions for you:
1) your charts are in 4 decimal for the column price. This mean you are quoted in pips and not in pipette for price with 5 decimals.
Who is your broker? I can't find a decent broker in pips.
2) I can see you are using "better volume" as indicator. Is that indicator from the Australian guy of "emini watch "? That guy is using VSA like you helped by 3 indicators that he developed (better volume, better momentum, better sinewive).
3) does volume strategy work on daily time frame? I have a regular daily job and cannot be an intraday trader.

Regards
Merka

Hello, Merka and welcome to the thread.
I am using ********** broker. I am using better volume indicator but let me clear you something, we speak about tick volume on Forex. I am using tick volume but I don't base a trade on tick volume. I am using Intermarket analysis to have a clear picture of activity for the specific currency pair. Let me give you an example. When I observe USD/JPY, I watch > Futures market JPY/USD where is volume centralized, I observe real volume from FXCM (its not tick volume, its real volume, and a number of transactions and lot size), I observe Nikkei 225 Index and then tick volume on Forex. On this way, you create a very good picture of the activity for a specific pair. All markets are in coleration and observing all of these you have a big advantage over average trader-investor.

Of course, you can trade any timeframe and any insturment. On the daily time frame its more about pattern recognition and climatic actions.

Best Regards,
Petar
 
Hi Petar

Your approuc "Inter market analysis" is completely new to me but interesting.
I'm always open to new ideas...
I heard about FXCM real volume.
So, on daily chart are you saying it's not necessary to do all your process but just analyse the chart (price action, volume, etc....)?
I'm a supply&demand trader but I would like to add volume analysis to increase my odds.

Would you like to explain your analysis process going through one of your recent trades?

Regards
Merka
 
Hi Petar

Your approach "Inter market analysis" is completely new to me but interesting.
I'm always open to new ideas...
I heard about FXCM real volume.
So, on daily chart are you saying it's not necessary to do all your process but just analyse the chart (price action, volume, etc....)?
I'm a supply&demand trader but I would like to add volume analysis to increase my odds.

Would you like to explain your analysis process going through one of your recent trades?

Regards
Merka

Basically, you can just watch daily price action and do volume analysis. Even, I put pending orders on daily chart when I see a good opportunity.

Usually, I like to trade fake breakouts and confirm with volume spread analysis. For example, this is my current intraday sell on USD/JPY.

After the massive volume spike, the price managed to go for automatic reaction and then went above climax bar to close the aggressive sellers. From the other side traders who trade breakout, they bought on the breakout of high climax bar and they also got trapped, because the smart money sold strongly there and did the fake breakout. I also Sold after there and I am watching price action to manage the position. The same principle is for all time frames.

So, i am watching for volume spikes, range bar extension and fake breakout for potential setup.
 

Attachments

  • USDJPYM5.pngsetup.png
    USDJPYM5.pngsetup.png
    67.2 KB · Views: 213
Another example is on GBP/USD.

Pretty much similar like on USD/JPY :)

Closed GBP/USD +80 pips :)
I did put SL on USD/JPY on breakeven and I am observing price action to see where I can close.
 

Attachments

  • GBPUSDM5.pngtp reached.png
    GBPUSDM5.pngtp reached.png
    95.1 KB · Views: 236
  • USDJPYM5.pngsecured.png
    USDJPYM5.pngsecured.png
    73.7 KB · Views: 231
Let's try to go ahead of Retail Sale in US. I found that sellers got no power for the lower price.

I marked on the chart letters > EUR/USD chart 15M

a - Highest volume bar of the day and very weak supply. The bar closed in the middle and we got an average range of the bar. This is for my a strong sign of strength.

b - No selling pressure bar. We can observe bar with the volume lower then previous 2 bars.

c - Test of supply in a volume below the average. Entry level.

Got small position there, just trying to preposition before the news in 25 minutes.

SL is around 25 pips and TP is opened.

Petar
 

Attachments

  • EURUSDM15.pngvolume.png
    EURUSDM15.pngvolume.png
    50.8 KB · Views: 220
My bread and butter trade

Climatic action in the background and fake breakout and up-thrust.

Lets see how far we can go >
 

Attachments

  • USDJPYM15.pngfake.png
    USDJPYM15.pngfake.png
    72.2 KB · Views: 224
Sold again USD/JPY intraday. Again fake brekout of 20 bars.

Lets see how this will go ...
 

Attachments

  • USDJPYM15.pngfaky.png
    USDJPYM15.pngfaky.png
    78.9 KB · Views: 265
GBP/USD made 20 bar low and retraced back. I am in and I will try to take 1:4 RRR. The bar wich made low is wide spread bar (climatic bar)
.
Best Regards,
Petar
 

Attachments

  • GBPUSDM15.pngfakekey.png
    GBPUSDM15.pngfakekey.png
    84.6 KB · Views: 248
have AUD/JPY long from 78.10 (short-term trade). Plan to hold 3-7 days.
I saw the fake breakout of 20 bars and price retraced very well. According to the 4H time frame, I found selling climax, which is a sign that smart money took most of the sell profits there and that AUD/JPY can reverse at least in the short term.

Best Regards,
Petar
 

Attachments

  • AUDJPYDaily.pngaudjpy.png
    AUDJPYDaily.pngaudjpy.png
    99.3 KB · Views: 221
  • AUDJPYH4.pngclimax.png
    AUDJPYH4.pngclimax.png
    102.8 KB · Views: 206
I am also holding NZD/CAD selling from 0.9022. Again, my bread and butter trade. Buying climax and wide spread of the bar. Smart money exited their longs and they started to sell, we saw that the very next day.

Best Regards,
Petar
 

Attachments

  • NZDCADDaily.pngsetup.png
    NZDCADDaily.pngsetup.png
    88.2 KB · Views: 243
Hello traders,
Today I found the strongest currency GBP. I like to buy GBP/USD especially after good news for GBP. I found a successful test of supply (hidden test), 20EMA acting like support whole morning and ADX is positive. Will try to take 40-60 pips.


Petar
 

Attachments

  • GBPUSDM30.png15.png
    GBPUSDM30.png15.png
    81.9 KB · Views: 238
Sold EUR/USD after the news.

SL is around 25 pips and will follow the price action for targets. I marked on the chart letters >

a - Massive volume spike and ultra-wide spread of the bar. First, potential sign that sellers may come into the market.

b - Supply in a high volume the very next bar and sign that sellers are on the market.

c - Up-thrust bar in a high volume, sellers still on the market.

d and e - No demand bars in a very low volume and ultra-low spread of the bars.

If you like analysis feel free to comment >
 

Attachments

  • EURUSDM1.pngselling.png
    EURUSDM1.pngselling.png
    69.4 KB · Views: 224
Sold EUR/USD after the news.

SL is around 25 pips and will follow the price action for targets. I marked on the chart letters >

a - Massive volume spike and ultra-wide spread of the bar. First, potential sign that sellers may come into the market.

b - Supply in a high volume the very next bar and sign that sellers are on the market.

c - Up-thrust bar in a high volume, sellers still on the market.

d and e - No demand bars in a very low volume and ultra-low spread of the bars.

If you like analysis feel free to comment >

Hello traders,
Very good progress on EUR/USD

I am in plus 100 pips and +85 on the second position. I secured a position at +50 and +70 pips according to the recent price action. As you see, its all about price action and volume analysis. Smart money awaiting big news to establish positions.

Levels to watch > 1.1160 and 1.070

Hope that you also took good pips
 

Attachments

  • EURUSDM30.pngPRIFIT.png
    EURUSDM30.pngPRIFIT.png
    66.6 KB · Views: 172
Top