Petar Jacimovic
Active member
- Messages
- 195
- Likes
- 2
petar what price /time your entry etc ------- all the best with above trade
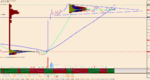
Exited GBp/JPY on breakeven and took EUR/USD BUY >
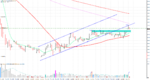
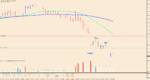
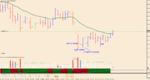
Strength on EUR/USD. I marked letters on the chart and will go through explanation.
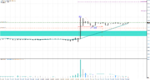
a - climatic action. The largest volume is seen in this bar and the bar closed in the middle. If there is real selling, how the bar can close in the middle ? It must be that smart money accumulating there.
b - the Narrow spread of the bar in a low volume. This is a test of supply. Confirmation that supply disappeared
c - another successful test of supply
Potential upward target is set at the price of 1.1215.
I think that smart money prepositioned before the news but we will see. Got small buy position there.
Petar