Volume analysis – The Key to the Truth

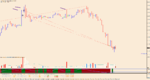
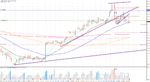
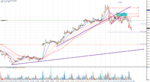
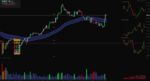
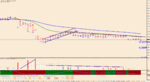
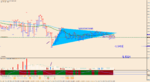
Sold EUR/USD after the news.

SL is around 25 pips and will follow the price action for targets. I marked on the chart letters >

a - Massive volume spike and ultra-wide spread of the bar. First, potential sign that sellers may come into the market.

b - Supply in a high volume the very next bar and sign that sellers are on the market.

c - Up-thrust bar in a high volume, sellers still on the market.

d and e - No demand bars in a very low volume and ultra-low spread of the bars.

If you like analysis feel free to comment >

Hello traders,
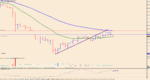
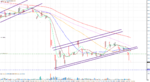
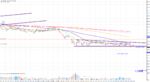
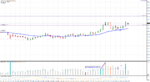
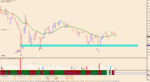
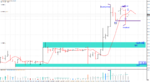
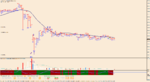
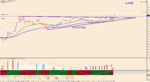
Very good progress on EUR/USD

I am in plus 100 pips and +85 on the second position. I secured a position at +50 and +70 pips according to the recent price action. As you see, its all about price action and volume analysis. Smart money awaiting big news to establish positions.

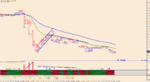
Levels to watch > 1.1160 and 1.070

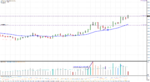
Hope that you also took good pips
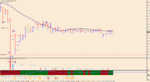
Took 4% on EUR/USD :)
 

Attachments

  • EURUSDM15.pngclosed.png
    EURUSDM15.pngclosed.png
    64.7 KB · Views: 240
I found strong opportunity on the USD/JPY. The trend is strongly downward. I found broken upward trendline and fake breakout of 20 bars. Also , there are no demand bars, which is a sign that bullish correction finished. I will try to take 1:4 RRR. The risk is around 20 pips an I am going for 80 pips.

Petar
 

Attachments

  • USDJPYM15.pngsold.png
    USDJPYM15.pngsold.png
    51.8 KB · Views: 183
Hello traders,
Today I only found Gold interesting for intraday trading. I found round bottom formation (saucer) and also flat horizontal base. I am aiming for $1.308.00 (yesterdays point of control).

Potential RRR is 1:4


Best Regards,
Petar
 

Attachments

  • GOLDM30.pngsetup.png
    GOLDM30.pngsetup.png
    91.2 KB · Views: 224
Gold - Strong bearish

I shorted Gold at the price of $1,293.00. I found sell off in a heavy volume, which is a sign that smart money exited their buying positions and started to sell big.
I found broken upward trendline also rejection from swing high according to the daily time frame. On the futures market, I found 320% increasing in volume in a sell-off .

My target is at least at the price of $1,237.00.

As I said in my previous posts. Volume is the key. The same chart and the same breakout without power and the strong spike in volume would be fake. Strong holders are big that you can't even imagine. So, if you go against them or if you trade when they are not on the market, you are exposed to the much bigger risk of failure.

Best Regards,
Petar
 

Attachments

  • futures.png
    futures.png
    69.9 KB · Views: 133
  • GOLDH4.png20000.png
    GOLDH4.png20000.png
    106.3 KB · Views: 236
Found another great opportunity on USD/JPY. I sold at the price of 104.25 with SL around 70 pips. Anyway, I will try to take at least 400 pips. I found a massive supply in the background. I found clear bearish flag formation (re-distribution). On the futures market, there is more then 400% increasing in volume from the average 20MA.
All you need is trong liqudity and price action to confirm that.

TP opened ...

Best Regards.
Petar
 

Attachments

  • USDJPYM30.pngshort.png
    USDJPYM30.pngshort.png
    102.8 KB · Views: 214
Hello traders,
I am still holding my 2 main positions on GOLD (sell) and USD/JPY (sell). So far, Gold is in plus 1000 pips and USD/JPY is around breakeven. Will watch price action and let you know about updates or potential new opportunities :)
 

Attachments

  • USDJPYM30.pngstillholding.png
    USDJPYM30.pngstillholding.png
    105.4 KB · Views: 190
  • stillholding.png
    stillholding.png
    87.5 KB · Views: 305
Hello traders,
I am still holding my 2 main positions on GOLD (sell) and USD/JPY (sell). So far, Gold is in plus 1000 pips and USD/JPY is around breakeven. Will watch price action and let you know about updates or potential new opportunities :)

Closed on breakeven USD/JPY and still holding gold (currently +1400 pips) :0
 

Attachments

  • GOLDM30.pngupdated.png
    GOLDM30.pngupdated.png
    134.3 KB · Views: 195
Hello traders,
I took sell on EUR/NZD. I found strong selling pressure on the market in a high volume and there is descending triangle pattern. Going for at least 1:3 RRR
 

Attachments

  • EURNZDM30.pngsetup.png
    EURNZDM30.pngsetup.png
    77.6 KB · Views: 127
Hello traders,
I saw strength on the GBP/USD. Have long there from 1.4855.Upward trend and successful test of supply in a low volume . Demand is very strong in the background. TP at 1.5040. Anyway, will follow setup and manage manually.

Best Regards,
Petar
 

Attachments

  • GBPUSDM5.pngintraday.png
    GBPUSDM5.pngintraday.png
    72.2 KB · Views: 183
Hello traders,
I saw strength on the GBP/USD. Have long there from 1.4855.Upward trend and successful test of supply in a low volume . Demand is very strong in the background. TP at 1.5040. Anyway, will follow setup and manage manually.

Best Regards,
Petar

+80 pips currently :). I am already almost 1:3 RRR so far... nice liquidity on GBP :)
 

Attachments

  • GBPUSDM5.pngsecured.png
    GBPUSDM5.pngsecured.png
    74 KB · Views: 202
Scalp

+5 pips on the EURUSD, the line is hard to see but it's there. Caught it late. haha.

Looked back saw that 50% was well respected earlier that day.
- Solid green volume off of it.
- Green all the way up to 1H
- Was a retracement back into the daily uptrend.

Hey hey hey! Nice to see another volume analysis trader. I scalp the market on the 1M timeframe cause I can't do the up and down swings. quick in quick out for +5 pips.

:clap:
 

Attachments

  • EURUSDiM1.png
    EURUSDiM1.png
    121.7 KB · Views: 240
+5 pips on the EURUSD, the line is hard to see but it's there. Caught it late. haha.

Looked back saw that 50% was well respected earlier that day.
- Solid green volume off of it.
- Green all the way up to 1H
- Was a retracement back into the daily uptrend.

Hey hey hey! Nice to see another volume analysis trader. I scalp the market on the 1M timeframe cause I can't do the up and down swings. quick in quick out for +5 pips.

:clap:

Hello there and welcome to thread :)
I am glad you took pips there.

This is my current view 1M chart on GBP/USD.
I see only strength >


a - selling climax ( it happened after the climatic bar). First major sign of strength

b - demand in a high volume and strong price action happens after the selling climax bar.

c - Bar closed in the middle in a high volume (sign of strength). This is also test bar because it tested the supply.

d - Another test and sign of strength from the same place where we saw previous test.
 

Attachments

  • GBPUSDM1.pngsetup.png
    GBPUSDM1.pngsetup.png
    80.5 KB · Views: 198
Hello traders,
I got a major position with 1% risk on EUR/JPY. I took sell at the price of 120.50 with SL around 40 pips. I found climatic action on EUR/JPY and a wide range of the bar. After that , the price did the automatic reaction. Anyway, i spotted lower swing high and breakout of AR support, which is clear sign for me that buyers exited their positions and that they sold.

TP 1 119.00
TP2 118.00
 

Attachments

  • EURJPYM30.pngbeauty.png
    EURJPYM30.pngbeauty.png
    78.4 KB · Views: 209
Found the weakness on USD/JPY >
I am bearish on this pair >

a - Massive supply in a ultra high volume (climatic action) in the background. The spread of the bar of 450 pips. The key thing will be to watch next bars and see where is the smart money.

b - Up-thurst bar in a high volume (supply overcame demand). Supply still present on the market and buying was very risky.

c - Wide spread of the bar but the bar closed in the middle. It is a sign of the strength. Since we already got climatic action in the background this represent taking profits from smart money and waiting for correction (public demand to see how much they can react),

c and d - a Narrow spread of the bars into new high near the level of 103.20. Buyers did their job and the smart money is ready to re-sell after they scaled out positions on the climatic bar.

Since I didn't saw that supply disappeared from the market, I am expecting re-test of the low at 99.00.
 

Attachments

  • USDJPYM30.pngsetup.png
    USDJPYM30.pngsetup.png
    67.2 KB · Views: 145
Similar scenario like on USD/JPY I am expecting on GBP/USD >

Massive supply in an ultra high volume in the background. The buyers reacted on climatic action but maximum they reached is the level of 1.3980. There I found the lack of buyers and low volume. Smart money started to sell again from that point. I don't even need to tell you that trend is very strong downward.

Pay attention to next levels >

1.3250 (Swing low from Friday)
1.2835 (Fibonacci expansion 61.8%)
1.2150 (Fibonacci expansion 100%)

Best Regards,
Petar
 

Attachments

  • GBPUSDM30.pngsetup.png
    GBPUSDM30.pngsetup.png
    75.6 KB · Views: 160
Recent scalp EU +4.9

Hey Petar,
Hopefully you had a good weekend. Decent day trading, had a couple smaller wins but this one is the best so far and day is still young, for me at least.

EU +4.9 pips.
- Consolidation break out with good volume is my main reason for entry.
- Side note entry reason: Short term down trend on the 1M chart.
 

Attachments

  • EURUSD1M.gif
    EURUSD1M.gif
    300.3 KB · Views: 239
Hey Petar,
Hopefully, you had a good weekend. Decent day trading, had a couple smaller wins but this one is the best so far and day is still young, for me at least.

EU +4.9 pips.
- Consolidation break out with good volume is my main reason for entry.
- Side note entry reason: Short term down trend on the 1M chart.

Hello there,
Nice to hear that you took pips there :)
I am doing very good, thank you for the question. Basically, I don't scalp since it is a way to aggressively style. I like to control setup and establish position on qualitative swings with a strong volume analysis.

I am holding USD/JPY short from 102.50 with target at 99.20 and I have on investors account GBP/USD sell from 1.3840.
 

Attachments

  • USDJPYM30.pngnow.png
    USDJPYM30.pngnow.png
    81.3 KB · Views: 181
  • GBPUSDM30.pngnow.png
    GBPUSDM30.pngnow.png
    88.4 KB · Views: 208
Shorted EUR/NZD.

The Strong downward pressure in the background in a high volume. The heavy supply wasn't removed. I found a symmetrical triangle and the successful breakout. I will watch for TP around 1.5325. Will try to secure around the price f 1.5450.

Petar
 

Attachments

  • EURNZDM30.pngssymmetrical.png
    EURNZDM30.pngssymmetrical.png
    95.2 KB · Views: 186
USD/CAD bullish opportunity >

I saw strong upward momentum and broken ascending triangle. I bought at 1.3110, SL is around 40 pips and I am going for 200 pips :)
TP around the price of 1.3300. There is also a successful test of supply in a low volume, which is a good sign for further upward continuation.
 

Attachments

  • USDCADM30.pngsetup.png
    USDCADM30.pngsetup.png
    74.6 KB · Views: 173
Hello traders,
4H timeframe,
I exited USD/CAD buying position since I found upward trap and I shorted USD/CAD at 1.3067 with SL 50 pips (will try to take at least 1:3RRR). I saw the fake breakout of prev. 20 bars and there is massive climatic action in the background, which is a sign for me that smart money already exited their long positions and that they are looking to short. My fixed target is set at the price of 1.2900. Anyway, I will follow transaction and may be let for few days.

I bought GBP/USD at the price of 1.3222 with SL around 120 pips and my fixed target is set at the price of 1.3950 (potential 700 pips) due to fake breakout of prev. 20 bars. There is massive climatic action in the background, which is a sign that smart money already closed their short positions.

Forex market is very manipulative and speculative so trading against most of the crowd is the way the smart money invest in Forex. It is much different from Stock market. A Clear example is fakeout process.
Let's take an example of USD/CAD. We are in an uptrend, we saw ascending triangle and the breakout of the same. Most of the traders will only try to buy and expect higher price but the market makers know about this and they put large sell orders and create a fake breakout. With this manoeuvre, they close sell orders on SL and they bring breakout traders to buy. When smart money starts to sell, the breakout traders getting nervous and they closing their buying position in SL or even join selling.

This is just my view on current market conditions. The best thing about these setups is risk reward ratio, which is very strong.

Wish you good trading and green pips
 

Attachments

  • USDCADH4.pngfaky.png
    USDCADH4.pngfaky.png
    108.9 KB · Views: 215
  • GBPUSDH4.png28.png
    GBPUSDH4.png28.png
    82.2 KB · Views: 122
Top