US Indices intraday trading - JULY 2003

Status
Not open for further replies.

SUNSEEKER

Established member
Messages
872
Likes
12
US Indices for the week 7th July 2003

good evening,

hope you guys and girls had a good time in the Midlands.

According to my stuff we are going down this week..

I will post my analysis in the morning....but I have a few problems with that spike on Friday...it really does cause me a headache right now.....

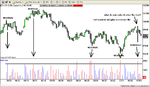
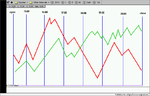
I have deloped a seperate entry strategy basis volume analysis on intra-day. I would be keen to hear from anyone who uses volume intraday as guidance, perhaps combine it with some of those slopy curvy stoch or RSI that you guys are experts in.

I have attached a chart so you NEVER forget the importance of ALWAYS watching volume
 

Attachments

  • volume reversal1.png
    volume reversal1.png
    23.2 KB · Views: 2,069
um, that spike that gave yuo a headache, wasn't that a result of some asshole punching in a sell order of 2000 contracts instead of 200?
 
morning car key, it must have been a lot more than 2000, unless we are talking man size contracts, but they are executed in the pit. 27,000 e-minis was executed in a couple of minutes which was 22,000 more than on the previous 3- min bar....

Blunder or not, the geometry stands, and that is what annoys me right now....

on my way to work, will post analysis from there
 
Good morning,

Friday’s spike was a strange affair and it has messed the patterns around a little for the day. It looks to me as if they managed to clean out the stops below. The low in the S&P pit was 976, while the low for the E-mini was 974.50.

There is a good chance that the high for the year is now in. I am looking for a good 50% correction as I have already said. However, there are still a lot of bulls in the market so I would expect the fall to be a grind lower. There is still a fair chance of another attempt to push higher today and tomorrow. The path for today looks lower but I can’t yet determine if it comes from a neutral level or it is from a gap up.

If the S&P500 manage to get above 995 today or tomorrow I would anticipate the index to go to 1008. However, below 985 I will be on the short side.

Although the long-term forecasting models are turning at this point I can’t be too bearish yet. If you look at the DAX index you can see that it is not prepared to give up yet. It has held the 3200 area so well and now looks set to attack the 3280 area again. This will be the 4th time. Either it will fail and turn down hard, or it will thunder through and go back to new highs. If it can get above 3288 there will a lot of stops activated.

What I am hoping for is early weakness this week and the beginning of the significant retracement. However, I will be more keen to short weakness than strength or at least wait for higher prices before putting on more shorts. The expected path today points to weakness from the outset of the regular trading session.
 

Attachments

  • path 7th july.png
    path 7th july.png
    8.1 KB · Views: 1,904
Good morning to you as well Tom.

It's certainly looking like a gap up at present. I shorted a while ago (too early in the rally) and have held out through the rally peak (and unfortunately through your forecast 1/7 rally), so am definitely rooting for a fall over the coming weeks. As ever the earnings this week will be critical, but it's looking like the markets are in bullish mood at present, with the Nikkei rising strongly again.

It seems surprising to me that the markets are still so close to their peaks given all that has happened over the lst couple of years, but some fascinating learning experiences here.

I'm in awe of your early July rally forecast as the mkts performed in line with your forecasts, and would like to thank you for sharing some of your views and data with us so openly on this board

many thanks and keep it coming
pad
 
Tom,


I am interested in your path for the dow. When they go pear-shaped you refer to them sometimes as 'inverting' does this mean they still hold some value because you can sometimes as you say "hold it upside down" - or do you bin the chart and go with the flow?
 
Good morning,

The NASDAQ bulls came back with a vengeance yesterday and squeezed all the shorts out of the market. The pattern reminds me very much of what we saw in 2002. I have attached a chart for you to view. We saw a huge 400 point rally in the Dow after the 4th July holiday followed by a drift lower for the next two weeks.

The next charts show the market in July 1933 when the US was in the midst of a depression. The Dow had rallied off the lows off 1932 but came off the boil in July 1933 for a decent correction.

I am essentially looking for the same pattern here. We got the rally and the lower high I was talking about. I am still looking for a downturn at this point. Essentially the market drifted sideways yesterday after the huge spike up. To me that suggest that someone is using every rally to get out of stocks. Institutions will never sell at the first top because they don’t know when the top is. They will however use the next rally after to offload their positions or put on short positions to protect their portfolios.

A reversal here would tie in with a bounce in bonds which has provided liquidity for equities.

I will use the 600 or 1000 basis point rule for a short entry. This means that I will short any retracement of 6 full SP points from a high, or 10 full SP points, depending on momentum. I think that a move below 1000 in the SP500 will be terminal.

The alternative is of course that we just continue to motor higher. I don’t really have a problem with that. I just wonder how Wall Street will justify the very high valuations going into the earnings season? I am sure they will find a way somehow!

The expected path yesterday was completely out of tune. I have attached two paths today because there is a potential for a gap opening in the indices followed by a sharp reversal around 16:40.

Good luck

Tom
 

Attachments

  • dow 1933.gif
    dow 1933.gif
    14.8 KB · Views: 1,707
and july 2002,

wish I could post all charts in one hit
 

Attachments

  • dow july 2002.gif
    dow july 2002.gif
    10 KB · Views: 1,503
and finally the path,

boy, I am looking forward to my holiday
 

Attachments

  • preparation 8 july 6.png
    preparation 8 july 6.png
    12.1 KB · Views: 1,427
Sunseeker - thanks for posting the charts. Can you, or someone, just tell me what the red and green lines are? Thanks!
 
Hi Sun,

Always a potential downforce from reported earnings, economic, and political news ........... a few gems re: the July 2002 period below:

http://www.nex.net.au/users/reidgck/JULY2002.HTM

Against the above 2002 scenario, we can anticipate the headline earnings being OK-to-good, but seen more as base-building on the back of widespread cost-cutting below the line ........ maybe more of the "uncertainties in the market going forward / cautiously optimistic" jabber.

Re: July 2003 week 1, we've had "Saddam's alive 'n' kickin" (....he's in Iran ;) ), "UN nuclear watchdog in Iran", "Iran test long-range missile capable of reaching Israel", "Bush reaffirming war on terror", AND the Walrus of Lurve has departed this world.

Putting it all together, I see us moving cautiously higher until the 'Iran Attack' position unfolds ......... maybe a gloomier outlook in August Michigan sentiment ............. never underestimate the power of Barry White :cheesy:

Maybe this ties in with the Sun's "major event" expectation - on occurrence, we'll be onwards & upwards to 10 000, or turning our attention back to the 7 000 zone.

Rudi

PS note re: Skim posting - red & green lines are 2 possible paths for the day: think the red route corresponds to "gap higher opening", as noted in Sun's post.
 
Skimble, my mistake .

i use to cycles that are usually uniform to predict the path...however, today there were two possibilities so given the track record yesterday ( 100% wrong) i thought I better post both possibilities..

:)))
 
thanks Rudolf..

valid points there! thx ...the longer we go here the worse those valuations will look, or should i say the better, and stretched....but hey, thats Wall Street for you
 
Hi Tom,

Keep up the good work - I was wondering if you could answer my question from yesterday re: expected path...

But before you do I have a comment on todays analysis, is it possible the introduction of 'curbs' yesterday explains the decline seen after the initial rise, rather than institutions unloading??


"I am interested in your path for the dow. When they go pear-shaped you refer to them sometimes as 'inverting' does this mean they still hold some value because you can sometimes as you say "hold it upside down" - or do you bin the chart and go with the flow?"
 
zcaprd7

sorry for not posting before....I try to determine the accuracy of the path within the first 10-15 minutes of trading....then I will know if it is accurate..

when it is, it is a very helpful guide....when it isnt, I keep an eye on it in case it changes again during the session,,,yesterday was a nightmare for me, but I always have a MOB, and the MOB was 994.25....I went long bove it...it tied in with a .618 of the range, and the high the day before 4th July.....

that is why I am watching this a potential low today...
 
Thanks Tom - what about the curbs yesterday, an issue or not??


richard quest must be on drugs!
 
Status
Not open for further replies.
Top