My first real chart example....please chime in and point out anything I should or should not be noticing.
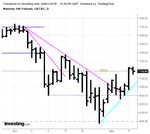
The newest UP move did not hold, and the reversal pushed through through the 50% mark very forcefully. This suggests weakness at this time.
Price has been arrested just above 6800, as it has a few times in the past. This is an important area of S/R to watch, and a break of this line will likely not find support until the last swing low area at 6600.
If it bounces upward, it is entering into a new, larger hinge that is forming. This could cause an explosive move upwards if price pierces the hinge's upper line.
If it remains in the hinge area until the end of the apex, then we are likely in a range area where equilibrium is being searched out.
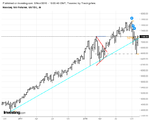
When analyzing price movement via a chart, it is essential to do it from left to right rather than right to left, forwards rather than backwards. Otherwise whatever hypotheses one formulates or conclusions one draws will be incorrect (the fact that nearly every technician reads charts from right to left is one major reason why they take years to learn how to trade rather than months; or weeks). This particular chart begins in 2016 (see post 288). It isn't necessary to go back that far, of course, but if you look at that chart, you will note that the upper and lower limits of your trend channel are too low. They are not wildly low, but why not begin with the correct placement?
I don't know the significance of the horizontal line placed under the swing low from May 23, so I'll set that aside.
Your goal appears to be the assessment of strength vs weakness. If so, none of these lines are going to do you much good. Trend lines have to do with assessing trend. Supply and demand lines have to do with assessing the balance between supply and demand. They are also useful in assessing the relative strength of buyers and sellers, and in this regard they can be helpful. However, in this particular instance, they are not particularly relevant. What does matter with regard to strength vs weakness is your assessment of what Wyckoff called "force".
The particular state of affairs in which we find ourselves began when the upward price movement peaked on Oct 2nd. This peak exists regardless of whatever lines one draws or even if one doesn't use a chart. It exists independently as a price point, a transaction. It then ends with a climax on Oct 11th after travelling 821 points. 50% of this move is 7318. Price rallies to 7368 which, at the end of the day, is positive, suggesting strength. However, this movement fails immediately the next day and drops almost 800pts over the next nine days. This does not suggest strength. It does reverse, however, at the apex of the hinge that I pointed out from April and May.
One needn't draw any lines to see that price has fallen over 1100pts. Nor does one need lines to see that the volume accompanying the price climax on the 29th (not the 26th) is far less than that which accompanied the climactic move on the 11th, which is consistent with a reversal scenario.
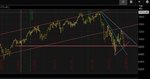
So now what? The midpoint of this entire move is 7154. Price reaches 7143 in its attempt at a rally on Nov 2nd but then falls. It tries to rally again the next day and reaches 7225 but then fails to hold this advance and drops back below the midpoint the next day. It then drops below the last swing low, which is where we now find ourselves.There may be evidence of strength today or tomorrow or Friday. Or next week. But the story so far has for the most part been weakness, and this story has been told by rally failures, not by supply and/or demand lines.
Technical analysis is not about lines and angles and geometric shapes but rather behavior, what buyers and sellers want and what they're doing to get it. These efforts sometimes form shapes, such as a hinge, but the shapes are coincidental to the behavior, not a driving force of it. The elaborate copy-and-paste posts about such constructions as "ascending triangles" which go into great detail about converging lines and angles and what to do when this or that line is "broken" miss the point entirely, and if those who are following these instructions ignore the behavior that's creating the "pattern" in the first place, they will most likely trade in the wrong direction and lose their money.
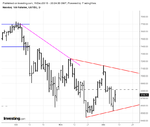
The behavior which defines a hinge is that of attempts on the parts of buyers and sellers to determine fair value. While an attempt to reach this agreement could begin as early as today, so far the story has been about failure (I suspect buyers are very disappointed that that reversal didn't amount to something more lasting), and as long as buyers are on the defensive, a hinge won't form. They can't deal from weakness. Algorithms don't change this one iota.
Complex? It can be, at least to the extent that behavior is complex. But complicated? No. Not if one keeps it simple and focuses on guiding principles of behavior. The midpoint of the move from Oct 29th to Nov 8th is 6905 and we're below it. What one does about this will depend on how well he assesses current conditions, which is what real-time trading is all about.
Db