Trading the NQ

Hourly SLA is pointing down. Just saying. Of course in the context of larger picture price has had quite a bit of a drop. The odds for down are lower now as compared to a few days ago but the arrow is downward.

The purpose of the lines is to draw the trader's attention to what price is doing, and price has been rotating around 7000 for the past 24 hours on relatively high volume. Where a line is pointing is less important than whether or not big money is going to support price at this level or let it drop further. If price is supported and reversed, the direction of the line isn't going to matter much. Note that Wyckoff took many of his reversal positions long before the reversal became obvious.

Db
 
You're right Db. Then again that was a pretty cool 140+ points move. Seems we're in a TR as per the rules now. Though 7000 area is showing some intent on the part of demand. Looking to the left does show a pretty significant area here. I am looking up as this huge drop is bound to have exhausted some supply. I hope all the fancy stuff doesn't happen during the after hours.

Gringo

p.s. Now that I have re-read your post I see the point. Thank you! Mr. Partridge.
 
Last edited:
Note also that the midpoint of the range price created for itself today is just above 7000.

Db
 
Testing times.

This provides a good example of what supply lines are and what they're supposed to do for you. Look for example at how price behaves at the cross between 0900 an 1000 when the supply line is broken, then the hour thereafter, then the hour after that. Looking at it after it's all over doesn't help much as far as entering a trade. However, studying it in replay will teach one what to look for in real time. The fact that price barrels ahead by nearly a hundred points suggests that something important is going on. This stuff occurs again and again. And the trader who trades price has a particular advantage.

Db
 
7000 seems like important for some reason. Someone had mentioned something like this earlier in the thread.
 
NQ daily chart

NQ Daily: Potential support did bring out the demand which seems to not be letting up.
 

Attachments

  • NQ Daily.png
    NQ Daily.png
    42.2 KB · Views: 260
The demand has evaporated. Perhaps price is going to push for the lows around 6900. I'll have to watch to see what is going on. These wild up and down moves are representative of indecision and uncertainty.
 
Nasdaq futures dropped over 100 in the 15minutes after the index close. How does that happen?
 
Nasdaq futures dropped over 100 in the 15minutes after the index close. How does that happen?

Or market wanted shorts to be squeezed in RTH and forced to buy and then went its way. Who cares what the reason was. For a few days this has been happening. Day before yesterday market was very low but right after the close blasted upwards in the after hours and kept going. Stick with the plan. Shorter term is still behaving as expected and lines are proving to be very valuable. Just keep eyes on major daily turning points as it is around these points these seemingly inexplicable turns are taking place.
 
Last edited:
I was walking with some colleagues at work, and they brought the topic of the market up amongst each other. They were trying to convince each other to hang in there and not to panic sell! I was shocked to hear it and realized how far along I have come in terms of how I think.

It wasn't something even in the periphery of my mind. Although I can understand a longer term investor holding through this, most people have forgotten what a bear market looks like. The previous crash was a decade ago and there are so many younger people who're all in with their investments with not much clue as to what kinds of moves can transpire in the market, and the effect of those moves on the human psyche.
 
Last edited:
NQ hourly

Just to give an idea about where to look for longs and shorts. It ain't rocket science. This is what the whole SLA/AMT is has been about. We can't predict the pace with which price rises or falls but can get a higher probability idea about which direction to pick and around which areas. It's more than enough for reasonable returns.
 

Attachments

  • NQ Hourly.png
    NQ Hourly.png
    58.6 KB · Views: 304
I wouldn't say that "this is what the whole SLA/AMT is has been about". Someone who knows nothing about either would look at your chart and snort that it's all hindsight. Which, technically, is true. However, those who have gone to the trouble of investigating the basics of either the SLA or AMT or both would know that the "whole thing" begins with deciding just what it is one wants, specifically (a) in what timeframe one wants to trade and (b) what interval he's going to use to trade it. For example, if one is interested in a months-long timeframe, he is most likely going to trade within that using a weekly or daily interval. If he is rather interested in weeks, he may use a daily or an hourly interval. Daytrading is not an option for the typical inexperienced trader.

Once he's decided on what timeframe he's interested in and the interval he's going to use to trade it, he then has to learn what a climax is and what a test is and how to recognize these in real time. If he understands what a climax and test are but can't recognize them in real time, then he will spend his time dwelling on all those trades he should have taken instead of profiting from what he ought to have learned by then.

And this is where beginners stumble. They don't know, for example, what a climax is so they don't know how to recognize it, even in hindsight. And since they don't know how to recognize it, they don't know how to act on it. And since they don't know how to act on it, they compensate by drawing a bunch of lines (those who understand what the lines are and what they're for benefit from them, as you have done; those who don't understand any of this just wind up lost).

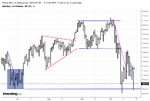
The reversal occurred on the 1st and 2nd. The retracement peaked on the 16th and 17th. If one acted on any of that, there is nothing left for him to do until price reaches a selling climax. He can track the balance between supply and demand as Gringo has done, but he doesn't have to. Imbalances between supply and demand are in and of themselves insufficient triggers. The trigger is the willingness of important money to stop and reverse the decline, and so far there has been only slight evidence of that willingness (e.g., the 11th).

Db
 
NQ Daily: SL breach and price struggling around yesterday's high. The pace is also slow. 7025-7045 mini TR.
 
NQ Daily SL breach

Bounce off the apex of the hinge Db identified some time back. Apex: 6600. If price continues down from here then there's a chance of a test if it comes.
 

Attachments

  • NQ Weekly TCs.png
    NQ Weekly TCs.png
    34.2 KB · Views: 237
  • NQ Daily.png
    NQ Daily.png
    33.1 KB · Views: 266
Bounce off the apex of the hinge Db identified some time back. Apex: 6600. If price continues down from here then there's a chance of a test if it comes.

Currently testing the last swing low (not counting Monday) at 6908.

Db
 
Top