You are using an out of date browser. It may not display this or other websites correctly.
You should upgrade or use an alternative browser.
You should upgrade or use an alternative browser.
dbphoenix
Guest Author
- Messages
- 6,954
- Likes
- 1,266
Avoid taking positions against the trend (by using demand and supply lines). A very simple way to preserve capital.
Agreed. However, as regards supply/demand lines, it's important for the beginner to understand exactly what they are and what they can and can't do. They do not, for example, provide support or resistance (nor do any other lines). Nor will an experienced Wyckoff trader exit a trade simply because a line -- supply, demand, or any other -- has been broken. Rather he will focus on the last swing low or high since these are something that everyone sees, whereas the lines the trader draws are something that no one sees.
Db
iplaygames
Junior member
- Messages
- 10
- Likes
- 1
If and when you do check them out, the following may be helpful. I wrote it nearly twenty years ago in order to help beginners understand that daily bars do not just spring forth whole; they are formed by the trades that take place during the day, and knowing how traders arrived at a closing price can be and often is crucial (the intraday "bar", on the other hand, is an invention of software engineers and has no particular meaning as there are no closes until the end of the session, or, in the case of futures, the end of the week; this will be of no importance to you if you don't trade intraday).
Whether you get anything out of bar or candlestick analysis may depend in large part on whether you are better at inductive or deductive reasoning. If I'm exploring something new, for example, I'll look for specific examples of whatever it is I'm investigating, then formulate preliminary hypotheses which are consistent with what I'm seeing. Then I'll apply those hypotheses to further examples in an attempt to come up with general principles. If those general principles hold over time, I'll ignore specific examples almost entirely unless I find one or several that seem to suggest that the general principle may have changed (or may not have been valid in the first place). Which is why I get very little out of the price bar/candlestick analyses provided by "experts" in books.
But whether one conducts his analysis via deductive or inductive reasoning, analyzing a given price bar/volume bar pair -- while interesting and even instructive -- is largely a waste of time in the larger scheme of things if one is trying to determine what it is he ought to be doing about whatever conclusions he arrived at. The reason for this is that a given bar is not anywhere near as important as the bars which follow it.
There is confusion, for example, regarding the significance or importance of high volume on a down bar. Is it a good thing? Or is it a bad thing? And the answer is that it depends. It depends on where the bar is, how long it is, where the open is on the bar, where the close is, the spread between the open and close, the distance between the close and the low, the distance between the open and the high, where support and resistance lie, what the market's doing, how strong the volume is and at what point the volume became strong etc, etc, and so on.
But even if one decides that the bar is a good thing, that decision can be no more than a preliminary hypothesis. The rubber meets the road in the bars that follow. Does volume increase or dry up? Does the price continue to fall or does it rebound? If support is being tested, does it hold? As with the beginner who asks whether a large trade is a buy order or a sell order, it doesn't really make any difference since one side of the trade can't exist without the other (otherwise it's just pending). What matters is the immediate effect on the stock. If it rises, the trade represented buying pressure. If it falls, it represented selling pressure. But it takes a few minutes to find that out. Is there enough demand to absorb that supply and propel the stock higher? Then hang on for dear life. Is there not enough demand to absorb that supply and propel the stock higher? Then get the hell out without hesitation and stand aside until you see where the decline tails off.
Even if you know the "meaning" of strong volume and a long bar (or weak volume and a long bar, or strong volume and a weak bar, or strong volume with a long bar in which the relationship of the open and close to the high and the low are . . .), you have to arrive at a set of general principles or else you'll never be able to act. And the ability to act decisively and with conviction is essential to maximizing profits. Understanding this can be a challenge even if one is unusually bright. With experience, that understanding will come if one applies himself enough. And there really is no way to understand it without experience. But the experience required to understand all this needn't take years. At the very least it can be accelerated by sitting down in front of a screen which contains a bar and volume chart (no indicators of any kind) and “replay” software. Set the speed fast enough so that you won’t feel as though you’re watching paint dry. As the daily bar forms, along with its volume bar, you can more easily develop a sensitivity not only to the struggle between bulls and bears but also the relative strength of each from trade to trade. Even a half-hour of doing this will lead to a great many Ah-Ha moments which are difficult if not impossible to reach by looking at static charts in hindsight.
this post is solid gold. it'd have saved yrs of my struggling with trading if only I could have read sth like this before. thank you so much for sharing your experience and wisdom so generously. thank you for taking your valuable time to help others 👍
iplaygames
Junior member
- Messages
- 10
- Likes
- 1
Bars often mask more than they reveal, particularly when it comes to intraday movement. While line charts can seem like a foreign language, particularly to post-'97 traders, they do offer a clarity that makes experimenting with them worthwhile.
Some aspects of reading real-time price movement are pretty much as difficult as they are with bars. Higher lows, lower highs, double tops, double bottoms are relatively easy to detect in real time. The ever-changing balance between buying pressure and selling pressure, on the other hand, presents greater challenges, as does gauging strength and weakness. Climaxes & tests and hinges provide important information, but one must also be sensitive to the story that price is trying to tell. A climax, for example, doesn't necessarily mean reversal; it can mean nothing more than exhaustion and an eventual sideways drift (trending, ranging, trending, ranging).
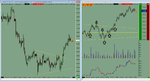
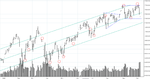
First, price breaks through the last daily/weekly swing high. The important money had seen the reversal on Wednesday (see post #157) and all eyes are on this breakthrough. Can it hold? Everybody's watching everybody else. It slips back below this level by a few points, but makes a double bottom and rallies back into a new high.
Volume is strong during this ascent, a reflection of the amount of both selling pressure and buying pressure. But price is ascendant, so demand has the upper hand. This is confirmed by the rapid dropoff in volume beginning at 1000. Some traders would call this a divergence and expect a reversal in price. But there's no divergence here, rather a withdrawal of supply. This enables price to rise with relatively little effort.
This initial thrust then wraps itself up for a consolidation, or rest, or breather, what one might call a natural close to the effort since those who initiated this and those who got in early will now be lightening up their positions or exiting them entirely. However, volume is even less than it was on the way up and price maintains its steady state, so there's no cause for concern even though price has moved nearly fifty points. Selling is calm, not frantic.
Volume then re-enters and price rises into a new effort, so the volume reflects buying pressure (there is of course an increase in selling pressure as well, hence the increase in volume, but since price rises, the buying pressure is greater). Price makes a double top with the high of the initial effort, which is cause for concern given the extent of this move, but it slips back by only half, suggesting strength. Given that volume falls off again, there's no reason to exit here.
Volume then re-enters big-time at 1100 and price is again propelled higher. This time, however, the angle of ascent is far less steep than that of the first move up. Finding buyers becomes more difficult. Volume again diverges with price, but supply is still minimal and does not impede demand. The move up isn't quite as effortless, but it is getting tired. Those who are paying attention to the angle of this ascent are put on notice.
Price then folds back on itself from 1230 to 1300. One could exit here, but the severe dryup in volume might encourage him to wait and see. When price resumes its rally on slightly better volume, the trader sees that it has moved beyond the halfway point of the decline, suggesting strength. Buyers then propel price to nearly 6225, at which point volume finally picks up. The bottom falls out of volume, however, when price tests the last swing high at 1245+/-.
So now what? Price has moved over 200pts in only three days, so a little profit-taking would not be unexpected. Price moved 250pts over four days in late August and retraced half the move over the next two days. We could do the same here, taking us back to what was the October swing high. If price makes its way toward 6250, I'd keep my eyes open.
thanks for the great example and clear explanation! I'm starting to connect the dots between price behavior and volume. it will still be very hard to do this in real time. but I guess I'll improve over time and practice. please post more examples like this if you can.
iplaygames
Junior member
- Messages
- 10
- Likes
- 1
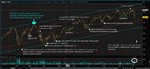
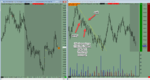
NQ20181005 price action after NFP
saw this hinge develop on NQ, drew it on a larger time frame, and watched price react around its edges and the mid-line. really amazing stuff. I tried to mark some bars as potential buy/sell trigger bar. am I doing this correctly? did anybody else see this and made trades? where did you place your trades?
saw this hinge develop on NQ, drew it on a larger time frame, and watched price react around its edges and the mid-line. really amazing stuff. I tried to mark some bars as potential buy/sell trigger bar. am I doing this correctly? did anybody else see this and made trades? where did you place your trades?
Attachments
iplaygames
Junior member
- Messages
- 10
- Likes
- 1
dbphoenix
Guest Author
- Messages
- 6,954
- Likes
- 1,266
saw this hinge develop on NQ, drew it on a larger time frame, and watched price react around its edges and the mid-line. really amazing stuff. I tried to mark some bars as potential buy/sell trigger bar. am I doing this correctly? did anybody else see this and made trades? where did you place your trades?
the hinge worked a couple more times when price came back to it. eventually price was able to blew through it. would you have taken the short at the marked location? if so, what is your reasoning?
I appreciate your responses to my posts, but I no longer comment on intraday charts or any chart with candles or colors or indicators of any sort. Or Forex or cryptos or penny stocks or options. My focus is on Wyckoff and the SLA. Otherwise everyone's time is wasted and life is short.
As to examples, I've posted thousands over the past twenty years but I can't say that they've done much good. If one is going to learn this, he must engage the market actively, as you appear to be doing, not just reading about it or watching somebody else do it. If one is going to daytrade the market, he must be in a position to follow his charts continuously, not just look at them now and then. If he can't, then he must reconcile himself to trading the daily chart and looking for trading opportunities there (we're in the middle of one now in the NQ/Q, but as far as I know no one has noticed).
I'll be happy to clarify what I can, even though the clarification may be no more than referring you to something I've already written.
Db
Lindsaybev
Junior member
- Messages
- 31
- Likes
- 7
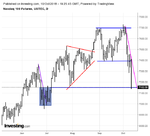
Good day, DB! I took your advice and started on the weekly. I then moved to the daily and have posted copies of each.Trend is the line of least resistance. One finds it by beginning with the weekly chart (see pages 37-41, the SLAB) or even the monthly.
You sound a bit frustrated in your last post. I can only imagine how trying it would be to explain these concepts to all of us, each with varying trading abilities and from different cultures, not to mention mental aptitudes...
For what it is worth, I will keep my posts to a minimum to allow you to stay on track. I am hoping that I am on the right track with what I have done this time around. I do see the collapse downward past the range in larger volume, also past the median of the channel. (Is this a shorting opportunity here?) However, I am just practicing actually making notations that make sense and looking at the opportunities at the oversold and overbought areas.
One q I did have regarding the the first touch of the overbought area on my chart (blue)...is that not a good place to exit?
If his risk tolerance does not allow him to stay in the trade when price reverses and drops below the swing low on Mar 2nd, he'll re-enter in April, sometime during the first week....
I made some notations on the weekly...
Attachments
iplaygames
Junior member
- Messages
- 10
- Likes
- 1
thank you for the reply! I'm new to this thread and about half way through reading your posts. sorry if I broke any rules it's because I haven't read them yet. ever since I read about the hinge and the power play around them, I started looking for them in the market. and last night I found my first hinge in action. I was quite excited to see your teaching in active market condition. 🙂
I don't trade with any indicators, apart from volume and Cumulative Delta, which is just a graphic representation of the number of buy market orders minus sell market orders, and it tells me how urgent bulls/bears are. i don't use it for entry, but i do sometimes exit because of it.
I'm in the process of changing the candle sticks on my chart to bars. I'm already testing it out and feeling that it didn't impact my decision negatively. the colors of my chart are for the benefit of my eyes. I have glaucoma and the doctors recommended softer colors and advised me to avoid looking at black and white screens.
anyway yesterday's trading was very exciting and eye-opening. thanks again for sharing your wisdom and experience!
dbphoenix
Guest Author
- Messages
- 6,954
- Likes
- 1,266
thank you for the reply! I'm new to this thread and about half way through reading your posts. sorry if I broke any rules it's because I haven't read them yet. ever since I read about the hinge and the power play around them, I started looking for them in the market. and last night I found my first hinge in action. I was quite excited to see your teaching in active market condition. 🙂
I don't trade with any indicators, apart from volume and Cumulative Delta, which is just a graphic representation of the number of buy market orders minus sell market orders, and it tells me how urgent bulls/bears are. i don't use it for entry, but i do sometimes exit because of it.
I'm in the process of changing the candle sticks on my chart to bars. I'm already testing it out and feeling that it didn't impact my decision negatively. the colors of my chart are for the benefit of my eyes. I have glaucoma and the doctors recommended softer colors and advised me to avoid looking at black and white screens.
anyway yesterday's trading was very exciting and eye-opening. thanks again for sharing your wisdom and experience!
Whatever rules there might be emanate from your trading plan. Otherwise, the only important rule is Don't Be Stupid.
Volume is not an indicator. It is a record of a transaction, like price. Or time. Everything else is clutter. If one is going to trade price, it is essential that he rid his mind of clutter. If you want to know how "urgent" traders are, look at pace, extent, and duration.
As to color, the color of your charts can be whatever suits you. The color of your bars can also be whatever suits you. But each bar is the same color as every other bar that came before and that will follow. Anything else is clutter. When it comes to price movement, even bars themselves are clutter. To make this point, convert your bar chart to a line chart.
I'm glad you're excited about the trading. Understand, however, that nearly everyone who pursues this fails at it because of all the baggage they drag into the effort. As I've said more than once, trading by price requires a perceptual and conceptual readjustment that many people just can't make, and many of those who can make it don't want to. This doesn't bother me nearly as much as it used to because I've learned that everyone eventually must paddle his own canoe.
Db
iplaygames
Junior member
- Messages
- 10
- Likes
- 1
@db, thank you for the advice! I'll try not to be stupid. though if I am indeed stupid then I probably can not help it :cheesy:
the hardest thing about trading for me is knowing when/where to exit. it's definitely a lot more profitable to let the profit run, but I found myself mostly just grabbing a few ticks and run, as the market moves in my favor the fear of giving back is gradually mounting up to the point of my having to exit at least a potion of my positions.
today I tried to apply the SLA approach to my trading. although I still messed it up, what can I say, old habits die hard, but nevertheless, the result is a startling image between my old trade management method and the SLA approach if I had strictly adhered to it.
iplaygames
Junior member
- Messages
- 10
- Likes
- 1
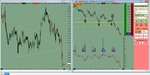
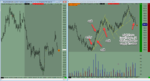
the first trade was a short, after entry, price almost immediately reversed, I usually would have exited already, but by reminding myself that the supply line was still intact, I was able to held my position through the worst of the chop. then price moved in my favor but once again it started to reverse. and fear grabbed me and I figured this probably was a trap so I'd better make sure I didn't lose much. so I moved my stop to breakeven, completely forgot about the supply line. and price hit my stoploss and resumed its downward progress.
yes I didn't lose much, only the commssion plus a couple of ticks slippage. but if I had remembered to follow the SLA approach, it would have been a very profitable trade.
yes I didn't lose much, only the commssion plus a couple of ticks slippage. but if I had remembered to follow the SLA approach, it would have been a very profitable trade.
Attachments
iplaygames
Junior member
- Messages
- 10
- Likes
- 1
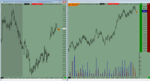
the 2nd trade was a buy. it was counter trend so I was nervous from the beginning. when the market moved up near a previous low, it slowed down a little and I immediately jumped the gun to exit half my position, when in fact the demand line was very much intact. the same thing happened a few minutes later when the market climbed higher to a previous resistance. I exited half of the remainder despite no threat to the demand line. and soon after, I exited the rest of my position because I figured it had climbed too high and had got to reverse now.
this was profitable trade, I made more than 150 ticks. but if I had followed the SLA approach, I would have made 3 times that.
this was profitable trade, I made more than 150 ticks. but if I had followed the SLA approach, I would have made 3 times that.
Attachments
iplaygames
Junior member
- Messages
- 10
- Likes
- 1
this was terrible, just had multiple losses, the market was moving real fast, and I was reacting to price action while at the same time trying to draw supply/demand lines. it was a very bad idea, because I found out I couldn't do both at the same time. when I finally got the direction right, I forgot about the demand line again and exited too early.
Attachments
dbphoenix
Guest Author
- Messages
- 6,954
- Likes
- 1,266
the hardest thing about trading for me is knowing when/where to exit. it's definitely a lot more profitable to let the profit run, but I found myself mostly just grabbing a few ticks and run, as the market moves in my favor the fear of giving back is gradually mounting up to the point of my having to exit at least a potion of my positions.
today I tried to apply the SLA approach to my trading. although I still messed it up, what can I say, old habits die hard, but nevertheless, the result is a startling image between my old trade management method and the SLA approach if I had strictly adhered to it.
As I said Friday, I no longer comment on intraday charts. If you want to apply the SLA to your trading, begin with the weekly chart. Otherwise, you're just wasting your time.
Db
Gring0
Well-known member
- Messages
- 264
- Likes
- 128
I'd second that intraday trading for learning purposes is quite a bit harder. Once one has become adept at longer bar intervals with a slower pace of decision making it is much easier to go with shorter intervals. It's more important to know why a decision is being made and to have had thought and followed a trading plan than it is to try to make a quick buck with missing bricks in the foundation.
It all comes together eventually (hopefully) if one keeps refining the thinking. I have found hourly bar intervals and 5 hourly to be the easiest in conjunction with weekly and daily larger trends. Do the right thing. Having a steady job and the ability to trade without the fear of making a living is a wonderful advantage to have. Use all the advantages. My life is becoming easier by doing the easier trading. There's nothing wrong with taking a path that is less dangerous. Getting to the other end alive is more important.
Gringo
Gring0
Well-known member
- Messages
- 264
- Likes
- 128
NQ mayhem
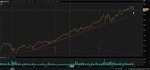
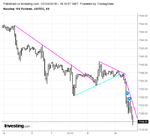
It's been quite exciting for the past few days. I tend to forget how fast the drop comes and how persistent it can be. Thanks to the lines, life's not under duress.
NQ has seen quite a drop. There are signs of potential support here but who knows? I am alert to some kind of signs of a turn sooner rather than later. So far daily and hourly have a clear downward trajectory.
Gringo
Attachments
dbphoenix
Guest Author
- Messages
- 6,954
- Likes
- 1,266
It's been quite exciting for the past few days. I tend to forget how fast the drop comes and how persistent it can be. Thanks to the lines, life's not under duress.
NQ has seen quite a drop. There are signs of potential support here but who knows? I am alert to some kind of signs of a turn sooner rather than later. So far daily and hourly have a clear downward trajectory.
Gringo
7000 has been important to big money since the middle of May. A "V" reversal is unlikely, but there may have been some half-assed capitulation today. Not what I would like, but the market couldn't care less what I would like. No reason yet to exit the short.
Db
Similar threads
- Replies
- 0
- Views
- 2K