Trading the NQ

I. I am struggling with the RETRACEMENT.

"Enter on the retracement, a few ticks above the trough of a \/ retracement, and a few ticks below the crest of a /\ retracement." What I am understanding is that a \/ retracement comes when a DEMAND LINE is broken, and a /\ retracement comes when a SUPPLY LINE is broken.

I am starting to write down some "rules" to backtest, but want to make sure I understand clearly. Not sure why it seems difficult to me. But this is what I have written for when a "line is broken":

3. When price definitively breaks a line, EXIT.

When a Demand Line is broken, we are looking for a Short, and enter a few ticks below the crest of a /\ retracement. A break of a Demand Line and a failure to fall says that price is not going to go down. It will either travel sideways or go up...so in this case, watch for a Long.

When a Supply Line is broken, we are looking for a Long, entering a few ticks above the trough of a \/ retracement. A break of a Supply Line with a failure to rally says that price is not going to go up. It will either travel sideways or go down...so in this case, watch for a Short.

If it was trending and takes off in the opposite direction, wait to see if price can make it to the halfway point of the immediately-preceeding run (if it cannot, price is probably still too weak to change the direction and therefore will probably continue in the old direction. If it can exceed it, there is probably a reversal afoot.)

If it was ranging and breaks out of that range, wait for the pullback.

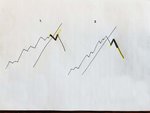
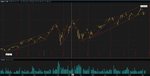
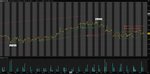
**I enclose a photo that shows two ideas regrading the /\ and \/. I am under the impression that the second picture is the correct interpretation, as I would not know that is was a retracement until it headed back the other direction.

Am I close?

II. The SLAB points out very clearly that we need to take the other time frames (among other things) into consideration, especially where a daily may be ranging, while the hourly may be trending. Are we just using this for possible reversal points but trading the SLA all the way through from these Resistance and Support levels? Or are we only trading the bounces off of and breakouts of these extrmes?

III. I had mentioned earlier that I planned on trading on the daily charts. I said this because (carrying old ideas forward, as you warned about) I was under the impression that it is the daily chart where I will find the longer, intermediate moves. I thought the intermediate moves kept us in for the longer runs, and yet kept us from worrying about the smaller, choppier moves. But I did not yet comprehend that the stops would be further away, opening me up to more risk. So, since I do have the time to work with shorter time frames, I am in the process of re-evaluating this strategy. And I want to thank you for pointing this out.

Lastly, thank you for taking the time to help us all learn. I can't say how invaluable your time is. :)
 

Attachments

  • 20180822_122310.jpg
    20180822_122310.jpg
    116.6 KB · Views: 268
Well, first comes the task of defining "definitively", which will aid in defining "breaks", all of which is part of characterizing one's market (see Appendix E). Until that's done, which is an important part of backtesting (and which has to be done for each and every instrument traded), everything is too squidgy to support confidence and decisiveness.

But before all of that comes the task of understanding just what a RET is and why it occurs, neither of which has anything to do with lines. The purpose of the lines is to draw the trader's attention to what price is doing at any given moment or segment of time. Are they necessary? No. But they are far more efficient. Even so, it is the behavior of price that is most important, particularly if one has drawn a line incorrectly or inappropriately.

So.

Price has been rising because buyers are buying, i.e., demand outweighs supply. They are more than happy to pay the Ask. However, at any given moment, those who have bought are content to have bought and to watch the dollar signs multiply. In order for this dynamic to continue, others must be enticed to buy, and these enticements can take many forms. At some point, however, not only will at least some of those who have bought decide that it's time to cash in at least some of their chips but those who have not yet bought will decide that what's being asked is just too much. Some will buy anyway, but most will decide to pass. At this point, price sputters and stalls, and unless new buyers can be persuaded to step up to the plate, price will roll over and begin to fall.

One cannot know except in hindsight whether this decline is only a RET or if instead it is a REV (although price could also segue into a range and move neither up nor down for an indeterminate period of time). However, the experienced trader understands that he must trade in an environment of uncertainty (if he is experienced, he is also competent; if he were incompetent, he wouldn't be around long enough to become experienced). This is known as "information risk", i.e., the trader must make a decision even though he doesn't have all the information he needs (if he waits until he has all the information he needs, his price risk will most likely be unacceptable: see "The Price of Admission", p. 85, as well as "The Danger Point", p. 77, in Notes).

As to your illustrations, either of these could result in a perfectly good and tradeable and profitable RET trade, ignoring your extensions, but they are sending different messages. The first is closer to a double top; the second includes a lower high. Therefore, it isn't the breaking of lines that matter but rather the double top and the lower high. As to which you take, or neither, or both, that will depend on how familiar you are with your instrument and with the traders who trade it (again, Appendix E). With your extensions, however, both of your potential RETs have become REVs as they have dropped far below their respective last swing lows (dropping below the LSL is one of the criteria for distinguishing between a RET and a REV), and if one ignores this, he is more likely making decisions according to his biases than to the behavior of price, which of course leads to arguing with the market (see "The Dog That Didn't Bark", Appendix B, paying particular attention to "Reversals vs Retracements", p. 72). One of the key elements that enters into a decision as to whether or not to buy is assessing how far price is most likely to fall before buyers see value and become interested in re-entering the market for this instrument, and that can be determined only by becoming familiar with the instrument in question (again, Appendix E). "Support" and "resistance" of course play a part in this, and if support after a rollover is quite some distance away, the trader may decide to go ahead and short the instrument even though the trend on the longer timeframe is still up. Whether or not he does so will depend of course on whether he has exited his long in the first place, and that will depend in large part on what his anticipated holding period was when he took the long.

Which takes us to your question about various intervals. If you're trading daily charts, your trading opportunities come from the weekly chart (review "Trading Opportunities", p. 60, in Notes). If one seeks long-lasing moves, he has to wait for them. This involves, in large part, looking to the weekly chart as this is what institutional traders are looking at, and if you want long-lasting moves, you have to be in synch with institutional traders (see "What Am I Bid?", p. 125 and possibly "Please, Sir", p. 103). Once that trading opportunity presents itself, you can then narrow your focus to daily and even hourly charts (in the meantime, you've had a life). Where you enter will depend on how much risk you're willing to assume, but having done all this work, your risk will be far less than if you were to just jump in because you can't stand the wait any longer and/or because it just seems like such a good idea.

Templates such as those you've posted are fine and they serve a purpose, particularly when one is trying to put across basic concepts. However, they are by their nature general as they are intended to apply to many different circumstances. When it comes down to where exactly do I enter and where exactly do I place my stop and when and under what conditions do I reverse my position, then specific examples must be provided (an example of what I do with the NQ is provided in post #179). Though learning from specific examples requires a certain facility with inductive reasoning, I'm sure you will have noticed by now that the book combines both deductive and inductive reasoning to suit everybody, or at least as many bodies as I can accommodate.

Db
 
With your extensions, however, both of your potential RETs have become REVs as they have dropped far below their respective last swing lows (dropping below the LSL is one of the criteria for distinguishing between a RET and a REV)...

Db

I made the charts as similar as I could without getting a ruler out. I meant to have the charts look the same. You are just so well-versed with the Wyckoff Way that you noticed all sorts of information I was not trying to impart. Ha! You ARE good. And, again, I learned a great deal.

I think where I am confused is that I keep thinking that both REV and CONT have RETRACEMENTS. I wanted the pictures to look like a break of a Demand Line, where I would be looking for a short, and then getting in on the retracement. Hence, my confusion. I was in essence looking for a retracement on the original retracement, and then too new to know what I was thinking at all. Just like the Curious Dog. I re-read that section, of course, after I wrote.

All your notes are so helpful. But just when I have a grasp of it....I realize I need to go back.

Thank you, DB.
 
REVs generally offer RETs, particularly if the REV is unexpected. However, it is also possible for price to drop like a rock after breaking stride and provide no opportunity to enter. A continuation is the result of a successful RET. For example, if price breaks stride (and also breaks the demand line at that time or soon thereafter), it will then typically retrace -- move upward against -- the downmove that broke the stride, usually because traders aren't sure about what they're seeing. It is here that you want to enter. However, until the alleged "retracement" makes a lower low and "continues" its downward trajectory, it's not confirmed and price can instead move sideways or resume the broken uptrend.

Again, posting a specific chart example of your question is better than yet another example of mine, chiefly because you need to begin to become familiar with the characteristics of whatever it is you want to trade. But, absent that, here is yet another example of mine.

Here, price breaks out of the hinge and provides its first RET, unconfirmed, on May 14th. The entry stop is placed above this bar but far enough away from it so that the entry isn't tripped by a move that isn't committed, i.e., a serious move that is intended to move price forward. In this case, 5 points would do it. A trade like this isn't triggered but instead moves sideways for eight days. There is then a downward thrust that looks like sellers intend to take price back down into the hinge, or at least what was the hinge. However, there's no RET. Instead price returns to its range. If price had failed to get that far, that would have made a better short entry, but while it is important to look at what price is doing, it is equally important to look at what price is NOT doing, and what it's not doing is falling. This suggests that the likelihood is for an eventual move upward, not down.

On June 4th, price exits this range, though it does so on light volume. That it can do so on light volume tells you that there is little selling pressure (if there were more, volume would be higher), and the fact that there is little selling pressure tells you, again, that up is more likely than down. Now, however, buyers reach the same point they reached on March 13th when they stopped agreeing to pay the Ask and they again refuse to pay it. So demand dries up (see the volume), price stalls, and then rolls over. This downmove retraces on the 20th and is confirmed three days later, so if you shorted, you are now in profit. Price now, however, spends eight days moving sideways. This time, though, the bars are longer and the volume is higher than it was under similar circumstances in May. This tells you that there's a lot more disagreement about value this time and that the eventual move out of this is more likely to be decisive. If you're short, you will therefore place your cover stop just above 74. When it does move out on July 6th, it again does so on light volume suggesting little selling pressure, hence little resistance to an upward move. This reaches the March and June high but breaks through the next day. The day after that provides another tentative RET. This is confirmed the next day and price provides a series of higher highs and higher lows thereafter.

And, yes, this is hindsight. All chart reviews are hindsight. But without real-time hindsight analysis, any forecast regarding what price is most likely to do next is just a guess. Knowing what traders want and what they're willing to do to get it, which is revealed by their behavior, which is revealed by their trades, provides one with at least a clue as to what his strategy ought to be. Right now there's nothing to do other than enjoy the long.

If you have a chart you want to post, please do so. Otherwise it's pretty much just philosophy.

Db
 

Attachments

  • SPY.png
    SPY.png
    27.4 KB · Views: 309
This is as close to real time as I can get. Price has exited the hinge. However, it has not yet made a higher high than the last swing high on the 9th. Therefore, the unconfirmed RET that bottomed on the 17th remains unconfirmed. But whether it is confirmed or not has nothing to do with whether or not the trade should have been taken. If it is confirmed, that confirmation calls for one set of tactics. If it is not confirmed, that lack of confirmation calls for another. Either way the long should have been taken on the 20th.

As for exiting the hinge, that is not so much a momentous occasion as making a higher swing high since the line drawn by the trader may not be accurate. However, the last swing high is the last swing high, regardless of what anyone thinks about it. No one is expected to do anything about it; it just is.

The next hurdle, of course, is the swing high before that, at 182.93. What buyers and sellers do at that point will make for interesting speculations.

Db
 

Attachments

  • Q.png
    Q.png
    24.9 KB · Views: 309
The NQ has breached Friday's high and reached a new ATH, so of course the Q will do the same once the market opens. All of this confirms the RET and launches a continuation. These breakouts may of course fail, which is why a different set of tactics is called for rather than how-do-I-trade-this-RET, particularly with regard to stops.

Db
 
The trader trading longer-term will of course have less need to enter and exit. The Wyckoff trader trading the Q off the weekly chart would have entered off the climax test in April or even May, while the trader trading off the daily would have been required to exit and re-enter multiple times. Whether or not the trader prefers the daily will depend in large part on how much he enjoys seeking out and initiating entries. And re-entries. And re-re-entries. If he prefers to stay in, then the task becomes finding sound reasons for doing so (see post 300).

Db
 

Attachments

  • Image7.png
    Image7.png
    49.5 KB · Views: 332
The NQ has dropped below its daily "supply line". But the last swing low is 300pts away. And you're long.

What do you do?

Db
 
Both the NQ and the Q have bounced off the halfway level of the upmove beginning August 15th.

Noon: price is now flirting with the daily trendline. If the trader had elected not to exit when price crossed the daily support line, he'd now be down 250pts (5.70 on the Q, +/-).

Above corrected to "daily" from "weekly". Early Onset Dementia.
 
Last edited:
I am looking at longs but the price itself though at an opportune area is so hauntingly silent. There's a stillness to the movement despite this big drop. This kind of behavior is ringing bells of warning in my head. Maybe the behavior will change in the afternoon but I am just observing.

The hourly SL is clearly down with no breach in sight.

p.s: Seems like life is back.

I've been focused on price behavior over the last few posts because too many people focus on lines rather than on what price is doing. However, those who understand trend, trendlines, and trend channels, and who have read the SLA, will have noticed that price reversed at the upper limit of the weekly trend channel after confirming that RET mentioned earlier and reaching a new ATH. They won't be surprised if price tests 7250.
 
Today constitutes the first and only RET, so far. However, given the 300pt drop preceding this activity, it could easily be a REV. The scenario that unfolded on June 21 preceded a continuation. The scenario that unfolded on July 25 resulted in a REV. Each was preceded by a 363pt drop. The drop preceding today's activity amounted to 304pts.

So do you go short or long? How? Where?

Db
 
Hinge. There was also an SLA entry. Hourly.

Note that there have been hinges every day for the past week. Trading the hourly can be an opportunity but it can also be a trap, which is why I suggest nailing down the daily first. By doing so, the inexperienced trader is better able to spot the higher-probability trading opportunities, then use the hourly to take better advantage of those opportunities.

Db

Daily is in a tight range. Based on live price behavior I am not so sure about the conviction of demand. I have had a few nibs at longs but again the price behavior was stressing me so I used the power of exiting for mental stability.
 
Daily is in a tight range. Based on live price behavior I am not so sure about the conviction of demand. I have had a few nibs at longs but again the price behavior was stressing me so I used the power of exiting for mental stability.

There's always the Q.

Db
 
Hello, DB!

...my first attempt at Trendlines, using the QQQ. Please just take a gander at let me know if I am doing it correctly. I started with the daily and then moved in to the hourly. I am just looking at the trend, not zooming in to follow the supply and demand for entries and exits yet.

It may be difficult to see (and I will change the opacity on my platform to minimize the open/close times in the daily), but I wrote down two q's: Is the trendline from the daily chart now acting as new resistance on the hourly? Is a new channel beginning on the hourly? Also, because price is now trading below the DL from the Daily, is the trend considered weak and I should be more disposed to a short, versus the slightly new upward trend on the daily within a channel??? LOL. So many questions.

Now, as per the SLAB, I would take this information and zoom in close to the hourly and follow the supply and demand, remembering what I learned about mean reversion and trend?

Am I "getting it"?

Thanks A LOT!

Wishing you well,

Lindsay
 

Attachments

  • Daily Trend QQQ.JPG
    Daily Trend QQQ.JPG
    192.2 KB · Views: 231
  • Hourly View of QQQ.JPG
    Hourly View of QQQ.JPG
    202.2 KB · Views: 202
Last edited:
Hello, DB!

...my first attempt at Trendlines, using the QQQ. Please just take a gander at let me know if I am doing it correctly. I started with the daily and then moved in to the hourly. I am just looking at the trend, not zooming in to follow the supply and demand for entries and exits yet.

Trend is the line of least resistance. One finds it by beginning with the weekly chart (see pages 37-41, the SLAB) or even the monthly. Looking for shortcuts in this process will most likely throw the trader off track and into the weeds, where he will then become immobilized by all the lines.

There's no need to go all the way back to 2009 to trace the trend. This is done in the book. For the current purpose, it is necessary to go back only to the last change in the trajectory: June '16. This trend is confirmed in Nov-Dec '16. There are various trading opportunities thereafter (see pages 42 and 43), but for the purpose of illustration, we'll look only at the context by the period from Feb '18 and following. By this time, the trader has his trendline and his "overbought" line, the two of which provide his channel. Price drops below his trendline into oversold territory the first week of February. This presents a trading opportunity, and since the trend is not broken, that opportunity will most likely be found on the long side (if he is not already long). However, unless the trader is trading other people's money, he is not likely to take it. If he is an experienced Wyckoff trader, he'll note the climactic nature of volume and price by turning to the daily chart (Feb 6 and Feb 9) and buy the test in March. If his risk tolerance does not allow him to stay in the trade when price reverses and drops below the swing low on Mar 2nd, he'll re-enter in April, sometime during the first week, after having evaluated the relationship between price and volume during that period. If he doesn't enter there either, he has another opportunity to do so during the last week of April. If he still doesn't enter, there is one last opportunity the first week of May.

There are other subsequent opportunities, of course, but they are all well above the trendline and stem from swing lows and the demand lines drawn off them, i.e., the range lows the second half of May, the swing lows at the end of June and July, and perhaps the range lows of the past week, though if the trader still hasn't initiated a long trade, the price risk he must assume is likely intolerable.

The trader finds his trades by plotting the weekly chart and looking for potential trading opportunities. When they present themselves, he then turns to the daily chart to find an entry. There is no need to refer to it until the weekly signals the potential opportunity. One line, or, at most, two. Does this mean that the trader will be pouncing on the first opportunity? If he is a Wyckoff trader, no, or at least not necessarily. He will rather be looking for the test (unless, of course, again, he's trading other people's money). The climax will by then be hindsight, but it will have served its purpose by alerting the trader to a change in condition. If the trader doesn't take the test either, then he needs to direct his attention toward his risk tolerance and his understanding of price movement and the relationship between price and volume. If all of this is in the past by the time the trader has begun examining the market and his risk tolerance and understanding of price and volume meet the market's requirements, he must then exercise patience and wait for the next trading opportunity to present itself, most likely as a test of the upper or lower limits of the weekly trend channel. Or search for trading opportunities in other mean-reverting instruments.

Db
 
Top