Trading the NQ

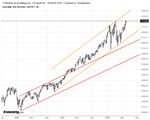
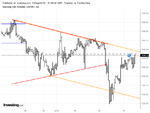
Remember why Wyckoff drew these channels in the first place. A chief reason was to provide a graphic display of overbought and oversold conditions, defined as those which drop below or rise above the channel (though Wyckoff didn't phrase it as such, this is what Steidlmayer was referring to with regard to value and how far traders will move away from it before returning to the median). Altering the trajectories of the upper and lower limits of the channel should be done only if absolutely necessary. Otherwise, all that information regarding overextension is lost and the channels become relatively useless.

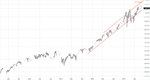
I know you follow this in real time, but take care not to draw these in hindsight just for the sake of shortcutting or summarizing anything. Knowing when to alter these channels in real time is challenging, and one has to focus on trader behavior as manifested in the bars rather than on lines. Even then, one can't be too eager to jump in. There will nearly always be tests of one sort or another.

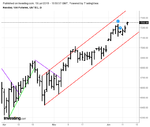
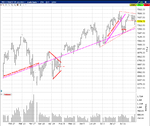
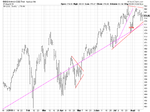
In this case, go back to your beginning, with the demand line drawn from February '16 to June '16. Draw a parallel supply line. This will stretch from April '16 to July '16 and beyond. Extend this line. Traders break through it the following February. Is this line tested afterward? When? What is the result of the test?

Those red channels aren't adding much to my understanding. Price has left the orbit and is so far away from them that I am not sure about the relevance.
 

Attachments

  • NQ Weekly TCs.png
    NQ Weekly TCs.png
    56.3 KB · Views: 189
NQ Daily

Here's the NQ daily with TC as I see it.
 

Attachments

  • NQ Daily TC.png
    NQ Daily TC.png
    44 KB · Views: 187
First Q for DB

Good day, DBPhoenix!

I am not sure if this is the apporpriate manner in which to get in touch with you. I recently purchased your most-excellent ZIP file packed full of various pdf's you have written. You mentioned then that I could contact you here.

So...What time frame would you suggest I begin watching price move? I plan on trading this method on a daily chart, but maybe to put in the "watching-the-chart time" I can watch it on a faster time frame, such as a 5-minute chart (or quicker?), so that I am not in the "watching phase" for months in order to see the waves and price/volume reactions?

What say you?

P.S. I love your humor! You kept that reading light....well, as well as could have been expected!(y)

Good day to you, too. Don't know why you received the pdfs as a zip file since they weren't transmitted that way, but if you got them and were able to open them, that's all that matters. As for your "watching the chart" question, this exercise shouldn't take more than an hour, though perhaps twenty minutes will be enough. The purpose of it is, as you say, to see the waves and PV reactions in real time (or via replay), moving. The market is a movie, not a slideshow, which is why those who study bars learn only how to trade bars, not price. Studying static charts has its place, but learning price movement, much less understanding it, requires, naturally, something that moves.

Once you understand that price registers as individual transactions, or ticks, and also that price movement is continuous, it isn't necessary to watch price move on an intraday chart if you aren't going to be trading it. You'll be able to see price "move" even if you're studying a daily chart from a year ago (see "Appendix D" in the SLAB). To achieve that understanding, study a tick chart. If a tick chart isn't available to you, study the smallest interval that your charting program provides, probably a 5s. But not for months. Or days. Or even hours. A half-hour may be enough.

Study "Developing A Plan", p21 in the SLAB, thoroughly, particularly the footnote beginning on p27 and ending on p29 (pages are not themselves numbered, but if you look at the small window at the bottom of the pdf frame, you'll see the page number with the total number of pages in the document). Then move directly to "On Volume, Volume Bars, Transactions, and The Tick", p13 in Notes. If and when that makes sense, move on to "Continuity of Price for Beginners: a Tutorial of Sorts", p21 (if "On Volume . . . " doesn't make sense, "Continuity of Price . . . " may clarify all of this. To cement all of this, study "Buying and Selling Waves", p43, "More on Waves", p45. Then study "Appendix D" in the SLAB some more (if you want to make a success of this, you're going to be spending a lot of time with "Appendix D"). For a quickie refresher, look at "Trading Price" below my signature. It's chief virtue is that it's short.

Db
 
And another thing. I don't know what you know and don't know, but unless you have a very clear understanding of demand and supply, much of this won't make any sense to you, and not only will you be wasting your time but you will likely become very frustrated. Therefore I suggest that you read "Demand/Supply" in Dbs Burrow first before venturing off into anything else as well as "Appendix C: The Law of Supply and Demand" in the SLAB.

Db

I have read everything you sent from beginning to end, highlighting multiple areas and instructions. I have traded using the O'Neill method you mentioned a couple times, moved on to the BB bands / MA approach, then finally read a book on candlestick formations....the typical route that brought me to you! i can't say that I have lost money...but neither have I done really well.

Just reading what you have written, I know that I have finally found something I can get behind, something which gets to the real heart of the matter. I am going to say I am a beginner, as your education on VOLUME alone has answered some deeply seated issues I have had in the past with other techniques. I am grateful to have taken the time to purchase these "text books" from you.

Except for pp 36 thru 67 in the SLAB, there's very little in the book that's linear. I'm not teaching a course so I leave it up to the individual to determine what he needs to know and locate whatever that might be in the book, such as how to go about observing. Eventually the holes in one's knowledge become obvious and self-teaching can become easier. In the meantime, the struggle can be annoying, to say the least, which is why the "Developing A Plan" section may be the most important part. Even so, the mental preparation required can't be overlooked, so "The Mind Game" is at least of equal importance. The chief advantage of digital text is "Ctrl+F". Even so, there may be something that you need to know yet don't know what to look for. If so, just ask and I may be able to help find it rather than leave you to drag yourself through 400 pages.

Good luck. And if you have truly read everything, you really ought to treat yourself to something.

Db
 
Except for pp 36 thru 67 in the SLAB, there's very little in the book that's linear. I'm not teaching a course so I leave it up to the individual to determine what he needs to know and locate whatever that might be in the book, such as how to go about observing. Eventually the holes in one's knowledge become obvious and self-teaching can become easier.

Good luck. And if you have truly read everything, you really ought to treat yourself to something.

Db

Good Day, DB! No, the book(s) may not be "linear,' but in order to find out what I did not know, I had to read through it all from cover to cover. And I enjoyed it immensely. I am grateful that you took the time to write all of this down for us.

I had realized how silly my original question seemed after I had already sent it off. In fact, there are several times in your notes that you mention "how" to study price movement from its origin. But I was not sure how to delete / edit my question as I was unable to get to it before it was moderated and then posted.

I was one of the people who was evacuated for the Shasta County fire. I am now back in my house, back at the office, and ready to get back to work.

I appreciate your time. Thank you!
 
Last edited:
Good Day, DB! No, the book(s) may not be "linear,' but in order to find out what I did not know, I had to read through it all from cover to cover. And I enjoyed it immensely. I am grateful that you took the time to write all of this down for us.

I had realized how silly my original question seemed after I had already sent it off. In fact, there are several times in your notes that you mention "how" to study price movement from its origin. But I was not sure how to delete / edit my question as I was unable to get to it before it was moderated and then posted.

I was one of the people who was evacuated for the Shasta County fire. I am now back in my house, back at the office, and ready to get back to work.

I appreciate your time. Thank you!

I haven't been through fires but I've been through floods and hurricanes so I have some idea of that feeling of powerlessness. From what I've been reading, you're lucky to have had a home to come back to. Let's hope you don't have to evacuate again.

As for your original question being silly, not at all. I was surprised to learn from more than one person that the impression was that this observation thing should go on for weeks, even months, when I never imagined that anyone would subject themselves to it for more than an hour or so. But then many people were also trying to cobble together trading plans at the same time they were observing these price movements, which served no purpose other than to make the process much longer than it needed to be.

It is, however, essential that one understand the continuity of price if he is going to trade price. If he doesn't, he's going to end up trading bars (or candles) like everybody else does, including the "price action" gurus. Granted that bars are a fact of life if one is trading daily charts, but then daily charts have a beginning and an end, an open and a close. But there are no opens or closes intraday, which you know now after having read all that. I won't go into that further if you're not going to trade intraday because it would more likely than not generate a headache. However, I do urge you to read Appendix D again (I've lost count of the number of times I've read it) and note in particular how Wyckoff sees movement even in static charts. This may seem like a gift, and perhaps it is to some extent, but it is more the result of years of reading the tape, and once one is accustomed to that flow, the idea of a "five-minute candle" is ludicrous, particularly if it has to be colored in some way.

Among other things, Appendix D is about trading behavior, not patterns nor setups nor pictures nor geometry (and by "trading behavior" I'm referring to "trading behavior", not "trading behavior", that is, trading other people's fears and inconsistencies and lack of preparation.) In fact there's something in Notes about trading the behavior, not the pattern. In any case, note how Wyckoff focuses on what the important money wants and what it appears to be doing -- based on price movement -- to get it. None of this is random. It is all purposeful. And if one can access these undercurrents through his understanding of important money's motives, he will at the very least avoid taking so many trades that have no future.

Db
 
Hello, DB! Good day to you!

I am now in the process of going over eveything I highlighted in your notes, and I have my first question on one of your AMT- lesson charts:

1.JPG

I get the fanning all the way up the upward trend with the demand lines. I get how we wait to see if a break will move sideways or downward and then take the retracement, depending on which way it occurs. I see how we change to a downward supply line when the price begins to move down, instead of sideways, and then we draw our supply line when price makes its first retracement.

But I don't get the green dot as a "retracement." It looks like sideways movement to me. No newer high seems to be made at this point either.

Would you please help me to understand this a bit better?

Thank you!

Cheers, Lindsay
 
Hello, DB! Good day to you!

I am now in the process of going over eveything I highlighted in your notes, and I have my first question on one of your AMT- lesson charts:

View attachment 254632

I get the fanning all the way up the upward trend with the demand lines. I get how we wait to see if a break will move sideways or downward and then take the retracement, depending on which way it occurs. I see how we change to a downward supply line when the price begins to move down, instead of sideways, and then we draw our supply line when price makes its first retracement.

But I don't get the green dot as a "retracement." It looks like sideways movement to me. No newer high seems to be made at this point either.

Would you please help me to understand this a bit better?

Thank you!

Cheers, Lindsay

The dots aren't wedded to any particular spot. Rather they designate a particular behavior on the part of the "composite trader". The red, for example, is at a location that is defined by a break of a supply line and a failure to rally. Price could just as easily have worked its way upward and made a new high. But it didn't. And that sends a message. Price isn't going to go up. It's either going to go sideways or down. In this instance, down.

However, when price falls, buyers quickly step up to the plate and propel price higher. Note the range to the left, around 3565. This is where traders found value before price move up to 3588. This constitutes "support". The trader who understands context is prepared for either a rally off this level or a failure at this level and is prepared for both. If he took the short, he's out as soon as the supply line is broken, though even without a line of any kind he should know that his short ain't gonna happen.

So then price does in fact stage a half-assed rally and immediately subsides. But the stock market is now closed, so this "quietude" is expected. But since the supply isn't again broken from the upside, this constitutes a retracement. And if one happens to be up in the middle of the night, he might take it. Or is he's trading from Bulgaria. However, the entire trough from the rally that breaks the supply line -- that is, changes the direction of the price movement -- to the next oomph that moves price out of this trough and past that same swing high constitutes a "retracement", i.e., price broke upward, but nobody was there to do anything about it so it subsided, waiting for everybody to come back to work. When they did, price made a higher high, confirming the retracement, and went about its business moving higher.

Where one enters is largely irrelevant, dependent first on whether or not the trader is awake but also how on long he intends to wait until his trade moves. Or he may wake up, see this retracement, or what appears to be a retracement, take the trade, place a stop below this sideways drift, and go back to bed. I prefer to "lead" my trades by placing an entry stop above price so that traders have to reach up to me. If they can't, then I'm not involved. If they can, then trade management takes over.

But that's not what you're asking. Once price breaks the downward stride, anything thereafter is a retracement -- since price is no longer rising -- unless and until price resumes its downward course. The supposed retracement is not confirmed until price makes a higher swing high. It could after all turn into a reversal. The trader can wait for the confirmation, or the reversal, or he can enter a trade with a tight stop and then wait to see if price exits this sideways movement and resumes its upward course. Given the bounce off 3560, odds are that price will rise, but there are no guarantees. No certainty. So the trader balances his risk tolerance against his assessment of conditions. Entry, management, which can include exiting if the trade doesn't work as expected.

One can of course wait for a higher high past 3588 and either buy that or wait for a retracement afterward. But Wyckoff focused on behavior. He understood what the money was trying to accomplish by having broken the mini-downtrend in the first place. He preferred to take a position in advance of the move that everyone would see, relying instead on the "everyone" to propel him into a profitable position. But this obviously requires an understanding of just what it is that the money has in mind. The LOLR -- the line of least resistance, the trend -- is up, and the dip down to the swing low at 3560 doesn't change that. Yet. It might. Price might fall for all sorts of reasons. But one plays the hand one is dealt.
 
The attached is intended for someone who sent me a PM but it appears that I can't attach files to PMs, so I told him I'd post it here. It's something I wrote about twenty years ago on market timing and anyone who wants to read it is welcome to do so, but I doubt that there's anything new to anyone who's been following this thread.

Db
 

Attachments

  • Market Timing.pdf
    980.8 KB · Views: 173
Thank you

The attached is intended for someone who sent me a PM but it appears that I can't attach files to PMs, so I told him I'd post it here. It's something I wrote about twenty years ago on market timing and anyone who wants to read it is welcome to do so, but I doubt that there's anything new to anyone who's been following this thread.

Db


Thank you for posting this and your kind reply to a newbie like me who almost certainly would last a short time in the trading field without speaking to traders who have been around for a long time.

I will read this tomorrow as it is getting late in the UK. :)
I will also research market timing further and see if I wish to take this further.
 
I prefer to "lead" my trades by placing an entry stop above price so that traders have to reach up to me. If they can't, then I'm not involved. If they can, then trade management takes over.

But that's not what you're asking.

Thank you for all that you answer. I am certainly new enough to understand that I may not even have the right question. LOL!

I get it now, but I also love to learn more. Thanks, DB!
 
A heads up.

Since the hinge in April/May, price has risen more than six hundred points. At the end of July, price broke the daily SL and plunged more than 50%. But it recovered the next day and staged a continuation two days after that, all of which indicated strength.

However, price then failed to make a higher high (waves, not bars) and that, along with the preceding higher low, suggest another hinge. The fact that price came to rest here at the end of the session is also interesting.

Db
 

Attachments

  • Image1.png
    Image1.png
    58.9 KB · Views: 176
NQ hourly

I am looking at NQ hourly like this. Lots of interesting stuff happening.
 

Attachments

  • NQ Hourly.png
    NQ Hourly.png
    43.8 KB · Views: 208
I am looking at NQ hourly like this. Lots of interesting stuff happening.

If however one is trading price and reads the chart from left to right, there is more here that is or was tradeable.

Note that price declines until the morning of the 13th. It then rallies to 7479. Demand is then withdrawn and price falls to 7397. This is a climactic drop, after which price rallies again to the last swing high at 7465, a level that it clings to for 10 hours. It then drops to 7316 and rallies to a point that is halfway between the upthrust to 7479 and the downthrust to 7397 (within four points). Price may reverse here just because, but AMT provides a different perspective. There were, in other words, a number of trading opportunities that presented themselves while the hinge was forming itself.

Db

There's a treasure of opportunities scattered across the price landscape. And not all the gems have been left untouched!
 
The following is an essential duplicate of the NQ chart I posted on the 15th. I post it here for those who have jobs and can't daytrade and/or can't afford to trade futures and/or are too risk-averse to even try. One doesn't learn how to trade, after all, by reading about it or watching somebody else do it. But then neither does one learn how to trade if he's paralyzed throughout the process. The price risk in trading the Q, however, which trades only during regular market hours, Monday through Friday, is about as minimal as it gets, particularly as the information risk is at least partly ameliorated by the NQ, which trades 24/5 and, in so many words, has the Q's back. IOW, one needn't trade in the dark, i.e., while stocks play their cards close to the chest, futures lay their cards out on the table: one need only to consult the futures trades to get at least a minimal idea of what to expect when trading in the Q begins.

One cannot trade profitably unless and until he grapples with his risk tolerance, which is a chief component of whatever fears he may have regarding trading. Minimize the risk and minimize the fear, at which point one can get on with the business of learning how to trade.

So. Applying the SLA to the Q, let's assume that the trader is at least aware of the weekly support line but is not yet comfortable with trading "oversold" conditions such as those which prevailed in February, April, May, and June, so he trades the daily action. Let's also assume that he drew a support line under the daily trades dating from the beginning of July. This line was broken on July 27th. The trader will hopefully have already decided where he's going to draw his line in the sand: a break of that support line, a breach of the last swing low on the 23rd, a breach of the 50% level on July 30th, a break of the weekly support line the next day (not the best choice as this is drawn by the trader, not the market), a breach of the swing low on June 28th (note that none of this stems from acting as a deer in headlights but from having made these decisions well in advance; if one knows exactly what to look for and exactly what he will do if and when each of these scenarios is launched, there's nothing to be afraid of). I've offered five scenarios. There may be others. With which are you most comfortable, knowing what you know about the market, the NQ, the Q, and yourself?
 

Attachments

  • QQQ.png
    QQQ.png
    34.5 KB · Views: 189
Top