Mactheriverrat
Member
- Messages
- 71
- Likes
- 8
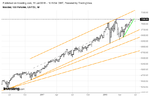
Nice chart!Price has broken out of the hinge and is still continuing upwards.
The trend is you friend.
Peter Lynch
Nice chart!Price has broken out of the hinge and is still continuing upwards.
Nice chart!
The trend is you friend.
Peter Lynch
Thank you for this Mr Rat 👍 :cheesy:
Price has broken out of the hinge and is still continuing upwards.
Just where can on find these notes at? Are they on T2W somewhere ? Just curious.
Notes is part of the book. The pdf you read is also part of it, and there is a Table of Contents at the end.
Price has broken out of the hinge and is still continuing upwards.
Thanks for the heads up!
Your posts and insight are very interesting indeed.Your Straight Line Approach is by far a better way of looking at trends.
I may not have 1000's of post credited to me on T2W but I think I have a good Idea of charts. So you will have to forgive me as I'm just catching on the this Straight Line Approach method.

BTW- Using SLA I entered JPM long yesterday afternoon.
Actually, using the SLA you would have entered at 105 on the 3rd or 4th, but you may not have read the pdf then. And as you are approaching the median of your trend channel, pay close attention to the price behavior.
For the sake of consistency, and accuracy, I should point out that SLA analysis always begins with the weekly. Drawing my own chart off StockCharts.com without the colors, I see that your lines are just ever so slightly off, which is not uncommon when drawing trendlines in hindsight. The lower limit of the trend channel, both weekly and daily, on the 3rd, was about 103.5. Given that the selling pressure lessened after the 13th, 105 may be close enough, and obviously was. However, the fact remains that entering here carries far more risk than entering at the trading opportunity itself. If buyers complete their business at this level, I would think twice about lingering.

Today I entered short Barrick gold;
My technical reasons are based on AMT, price finding strong selling at previous support, now resistance, around 13,8.
But I find myself requiring more than a technical signal to enter a trade. I´m not sure if Wyckoof or DB would approve of this . . .
My approval is not necessarily relevant. But this thread is about trading the NQ using the SLA. Since you have a journal, I suggest you post non-NQ charts and trades there, particularly if they aren't in line with the SLA.
This is how I am looking at the weekly. Price is around the median and moving upwards towards the top of the trend channel. The previous swing high is around here but supply hasn't shown much gumption so far to indicate it's something significant. Maybe someone else has a better view but for me it's time to remain patient.
Gringo
p.s The TC needs to be adjusted after the NH.