Trading the NQ

Hello DBP, what are your thoughts on this SLA entry in BTC

Using the lines you've drawn, there is a long opportunity on 2/26. This is stopped out and followed by a short opportunity on 3/12. This is also stopped out putting you in a range. There is no SLA trade until price exits this range.
 
ok my mistake, i thought your left chart was a shorter time frame. I see what you mean about the 50% but I thought the wedge shape I drew was also significant here?

Yes, I believe your wedge is for sure significant, I guess it's time to wait and see which direction price takes..
 
Using the lines you've drawn, there is a long opportunity on 2/26. This is stopped out and followed by a short opportunity on 3/12. This is also stopped out putting you in a range. There is no SLA trade until price exits this range.

Cheers DB! Let's see how things transpire then, it will be interesting to apply the sla if prices start trending again.
 
NQ Ret

NQ daily RET.
 

Attachments

  • NQ Daily.png
    NQ Daily.png
    41.1 KB · Views: 197
Only if there were brownie points for sitting pat and letting things unfold.
 
Last edited:
Bitcoin

Bitcoin:
This is how I see the daily. Long is calling with pretty reasonable danger point. Bitcoin isn't my thing yet so I am just an observer.

And this is a digression but hopefully not long enough to break the TC.
 

Attachments

  • Bitcoin Daily.png
    Bitcoin Daily.png
    37.7 KB · Views: 183
Last edited:
What happens without the lines

This is today's post while the market has been going up. It is at times good to be reminded of what the lines save us from. I have lived in this agony and can sympathize, but know there isn't much I can do to help. It doesn't matter whether the trader ends up surviving this or whether the market turns in a favourable or unfavourable direction. It's this kind of an experience that damages the psyche and then there's a long road back and that's assuming one figures it out that something of a mental sort needs fixing.

The lines are magical. Stay on the right side of the magic. The moment one needs another for advice during a trade, usually it means the trading plan isn't complete.


Vinod Kumar 39 minutes ago
Help frends i m in big loss plz pure hearted frends i m scared plz suggest me rout

B K Ang 39 minutes ago
Don’t worry, it’ll come down. It’s overbought already

B K Ang 37 minutes ago
Did you sell more lots to average your sell price?

B K Ang 36 minutes ago
That’s a strategy to bring your sell price higher so that you can exit earlier and make more money

Silver Gambler 36 minutes ago
Keep patience bro. It will come down sharply. I m also in sell side with big and big lots.

Vinod Kumar 33 minutes ago
Yes bro i have sell one lot more for average thanks to you both

Canuck Trader 33 minutes ago
I don’t know about averaging. This move looks real.

B K Ang 32 minutes ago
Silver gambler is right. This is the best time to put more sell order at this high price so that later when it plunge, you’ll make a lot of money out of the bulls. It’s a bull trap

B K Ang 31 minutes ago
You should sell double of your original lots to get better leverage and get profits faster
 
This is today's post while the market has been going up. It is at times good to be reminded of what the lines save us from. I have lived in this agony and can sympathize, but know there isn't much I can do to help. It doesn't matter whether the trader ends up surviving this or whether the market turns in a favourable or unfavourable direction. It's this kind of an experience that damages the psyche and then there's a long road back and that's assuming one figures it out that something of a mental sort needs fixing.

The lines are magical. Stay on the right side of the magic. The moment one needs another for advice during a trade, usually it means the trading plan isn't complete.

Assuming one has a trading plan, which is rarely if ever the case.

It's been almost eight years ago that I wrote "If You Can Draw A Straight Line . . . ". I had no idea at the time that so many people would in fact not be able to do so. When Forex came along, that just made the situation worse. And then of course there's been bitcoin . . .

Oh, well . . . :sleep:

Hello DBP, I would be very interested in reading your thoughts further on Bitcoin, since it´s price action seems singular to say the least, and even though folks insist on labeling it a bubble, so far price has responded to every obituary with a further upwave.

Some insist on labeling a bubble but others believe price is representing an S-type adoption curve which will eventually reach a stable platitude.

THis is how I´m reading the price action based on Wyckoffs Work, specially Section 7M and including your prior comments regarding the trading range. I know it´s nos strictly SLA trading but I would be very interested in reading your views on such singular price action.

attachment.php


Cheers!
 

Attachments

  • BTc Wyckoff.png
    BTc Wyckoff.png
    44.7 KB · Views: 1,009
What is your trading plan with regard to a potential purchase of this instrument?

Well, in my case Im not sure I would call it a trading instrument.

I am more interested in using wyckoff principles to establish the point at which supply is exhausted and entering devoting a part of my funds as a long term investment.

In other words;

-enter at the green Dot
-stop loss below 6435 since this would invalidate the premise that this is the bottom of the correction.

Any instrument that is bought and sold is a trading instrument, even if it's held for years.

What Wyckoff principles support your premise that this is the bottom of the correction?
 
Any instrument that is bought and sold is a trading instrument, even if it's held for years.

What Wyckoff principles support your premise that this is the bottom of the correction?

My thoughts;

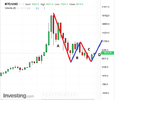
1- Determine the current trend of the Market (Monthly)

On the monthly, there was a strong upwave from the base at circa 200 USD$ to the top at circa 20,000 USD$, lasting approximately 12 months.
This was followed by a strong correction to 6,500 USD$ lasting 3 months.

Judging from the extent and duration of the longer term waves, buyers have the upper hand, however, Wyckoff considered the 50% correction as indication of strength and this was violated (the current correction was circa 67%), this warrants caution as a failure to move beyond the 50% level would suggest further weakness.

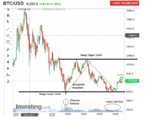
2- Ones place in the current trend (weekly)

attachment.php

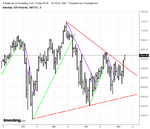
Zooming into the last 4 months of price action;

An initial downwave A took price from 20K to 6.5 K lasting 8 weeks

This was followed by upwave B from 6.5 K to 12 K lasting 3 weeks.

Then another downwave C from 12K back to test 6.5 K lasting 5 weeks

The fact that downwave C was shorter in extent and duration than downwave A suggests selling exhaustion.
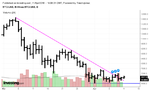
The analysis of volume also suggests a potential bottom; Volume spiked on 05/02 suggesting a selling climax and remained well below the climax levels during the test last week
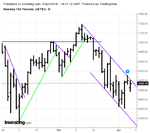
3- Proper timing
Finally, my entry was triggered yesterday following my prior chart after a break of the Supply Line and a Higher low at the bottom of the range.
 

Attachments

  • BTC weekly.png
    BTC weekly.png
    42.5 KB · Views: 956
FYI, a hinge has been forming recently, the high on 3/13 and the low on 4/4. This site doesn't provide for copying and pasting images without going through hoops but it's plainly visible if one knows what to look for. The "apex" of it is around 6600.
 
Top