Trading the ES (E mini S&P) November 2003

Status
Not open for further replies.
problem here

Alright mates 1st of all I am afraid it'll hv 2 b 3 posts since I can attach only 1 chart in a post.

I wud be the last person to "fit the curves". Our system which for 3 months since conception hs bn working as a swiss watch, ran into a problem on Friday. Which needs to be sorted.

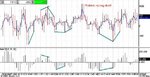
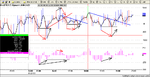
In this 1st post I am attaching the Tick pic of the day - all nice and clear - APART from 13:15 which was a reverse to S - but there was no neg divs to go along with.

OK - after 13:00 time pivot we r nicely long @ about 1033. We do a revision of the internals at 13:00, it is still a trend up day, and we already know the mrkt has bot the lower 1st hr pivot. By 13:15 we get buying climax with Tick above +1000 on 2 5-min bars at exactly the upper 1st hour pivot - BUT NO NEG DIVS whatsoever - so we reasonably expect the mrkt to buy that upper pivot from underneath.

Which goes pete tong.

What the author of this msg did was close L flat @ 33, go back L @32.5 on pos tick divs into the close. Which does not solve the problem of reversing at upper pivot @ 37 and going back L @ 32.5.

Let's first analyse the enemy we r fighting here. It is a rare breed indeed. Any divergence-based system implies several diverging tops/bottoms. Here @ 13:15 we had a lonely spike which faded. No wonder there were no divergencies.

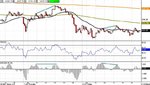
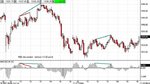
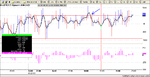
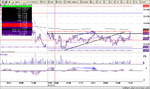
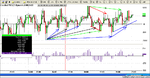
I do not know the solution yet but I think I am close. Ok - on a trend day (at 10:30) - we check if the trend is still there at 13:00. If not - like 20-11 - we just wait for our tick sequence to reverse. If yes - we CHECK MACD(5,35,10) of SP Cash and ES. If it's showing a div (AFTER 13:00 - this is important) without our Tick divs we do reverse the trend expecting to buy the trend back later (like 21-11).

IMPORTANT - look at charts from 20-11. MACD of SP Cash and ES do not bear any significance b4 13:00 (red lines). It is all trend - no trend - tick divs play.

let me know what u reckon
 

Attachments

  • tick2111.jpg
    tick2111.jpg
    40.7 KB · Views: 270
ES MACD on those 2 days

SP futures on 20-11 and 21-11
 

Attachments

  • spfuts2111.jpg
    spfuts2111.jpg
    51.2 KB · Views: 277
Re: Tick vs Trin

PMBI, have you had a look at wealthlabs.com, they have a pretty good programable interface.

Rgds
 
Re Tick

China White me old mate

You know how I like my peak and trough analysis. Well this is Fridays action with the triggers being based on the the trend line break of the two minute EMA. A lot less trades and only one failure.

Also, your MACD is 5 35 10 OHLC/4 smoothed to 10.

On divergences these are your set ups as I am still a bit confused.

Longs

HL MACD/rising tick bottoms/falling ES

Shorts

LH MACD/falling tick tops/rising ES

No you say, you do not see the absolute value of the tick as being important however I have posted a link concerning the Tick where they talk about re crossings of the zero line. What is all that about mate.

Cheers and thanks again to both you and Sandpiper for your help this week.

Andy
 

Attachments

  • dow 5min110.png
    dow 5min110.png
    24.5 KB · Views: 303
Stoploss,

matey i think u r still a bit confused about the way I comb Tick for divs :)

Alr8 let's forget here about MACD of ES divs against ES - this is a new bit I am contemplating here - and I am certain it's only use will be to filter out those rare (but rich) trend reversal days (or +10/-10 days).

Let's get down to Tick divs which r the spine cord of this system.

U'll have to take to charts matey - those of Tick and ES and place 'em right on top of each other 2 c what I mean. Take a butcher's at 21-11 e.g.

Sequence to do L:

1) HL on Macd of Tick with LL on Tick itself. on this stage it's largely unimportant what Lows ES makes.

2) Off that Lower Low on Tick - HL on Tick with LL on ES.

The 1st stage gives u a 'hands to battlestations" signal. 2nd stage is the proper Tick + div u trade on.

What yr sharp eye rightly noticed, is that since I am using 10 interval smoothing on 5 min charts - macd of tick readings over the first 50 min of trading r not reliable - they rake in meaningless readings from either previous session or after-hours, where tick is not defined - depending on the settings of yr charting software. First 50 min decisions R PUNTS made on Tick divs against ES ALONE!!!!

Now about those climaxes (above +1000) without divs. I I can c yr point, however if u start fading those climaxes without divs - u'll be burnt on sharp trend days. Like I said b4, imagine it's 1987 freefall - I can assure u Tick will be below -1200 all day long. R u gonna be buying all day long matey? :)

As per your ascending/descending bottoms/tops this may BE EXACTLY WHAT I AM LOOKING FOR - regarding this issue of fading upper pivot @ 1037 on Friday without neg divs. I may not need those new bits with MACD of ES at all......

I am not yet saying u found the gem :) but I think u r closer than me at the mo. What i'm gonna do now is to sift thru quite a few trend sessions to c how it behaves.

Many thx for yr ideas - let's hv it sorted! :)
 
Tick

CW

Sorry mate, I am being a bit thick today. Anyway I think I understand where you are coming from.

Longs
LL Tick / HL MACD and then HL tick.

Shorts
HH Tick/ LL MACD and then LH tick.

If you draw trend lines linking peaks and troughs and look for breaks, you seem to get the same results.

Ta
Andy
 

Attachments

  • dow 5min113.png
    dow 5min113.png
    23.7 KB · Views: 272
MACD of ES

CW

The same problem area, your MACD setting was signalling weakness.

Cheers
Andy
 

Attachments

  • dow 5min115.png
    dow 5min115.png
    26.5 KB · Views: 284
matey matey - u r still confused as I can c..... :)

yr quote:

Shorts
HH Tick/ LL MACD and then LH tick.

No mate - its HH Tick/LH MACD (of Tick); then HH ES/LH Tick!

However - u've got the same chart with correct markings - so u must be just mis-typing.

whch brings us back to 13:15 NY time problem on Friday (18:15 GMT) - there were NONE of Tick neg divs - but still a top @ 1037!

Now - as for yr last post - that's MACD on ES itself, not on Tick. U may take a look at my charts for SPX and ES on 20-11 and 21-11 above - this is exactly what I am pondering at the mo - how to filter out reversals on trend days - and whether this MACD on ES or your trendlines on Tick 2 ma works better..... analysing cartloads of charts as we speak! :)

last piece - that res at Tick +500 u drew on 1 of yr charts. I'd be strongly against trading on such arbitrary lines. Tick being @ say 600 means nothing - u can be + or - diverging at exactly the same level. I'd be extra cautious drawing conclusions from absolute values of Tick.

cheers matey
 
CW

Yep, that was a typo. Sorry mate.

Now, the way I view that absolute tick value for the 21/11 is that the value of advancing shares against declining shares could not get over 515 on four occasions were three of the approaches were turned back at that red Resistance level in the tick. On the break above this line, I would have hoped to see an expanding positive tick difference which signified participants jumping into the weaker stocks in the hope that they will be dragged up by the market momentum. The tick would then possible suffer a slight retracement which should receive support at the 515 figure. As soon as it broke beneath the resistance that became support all those new speculative longs started s******* bricks which put in our top.

Is this too a simplistic a view. Still trying to understand the nature of this beast. What do you think.

Cheers
Andy
 
ok - mate r u storing those excellent ideas under yr carpet???? :) sup/res resolution on tick MA - that may be it. I need to test at least a cupl of previous weeks 2 c how it works. still a bit suspicious - since anyway u start tagging yrself to a particular number on Tick - which I believe has no relevance - but it may be ascending/descending lows/highs on 2 MA of Tick chart that put the final touch to this already very robust system. let's bloody well sort it out matey. My mate and I - we've got his feeling that we r a whisker away from the best sys we've ever come across. Not intending to brag about it - since its conception I've had 3 losing trades, max 1.5 pts loss - over 3 months now. This may be the final bit - "the royal seal" if u like.

since u've got so many ideas - pls don't hide any of them mate :)
 
lads/lasses - I know I've got loads of things to study and revise after Stoploss's brilliant ideas - but it's 2 pm Mexican time - and I graciously retire to the local bar to celebrate! Cheers to all of u - personally i didn't believe we'd be World Cup holders in my lifetime - in any sport apart from lager keg lifting :) Great day - England finally produced a sportsman bigger than Becks! :) Cheers all! later
 
CW

I have a theory. All the books and seminars on TA are designed to bring fresh meat for the market makers to chew on. This is because even the best books like Murphy only provide you with strategies which the market makers and Spread Betting companies know so when ever a new confident newbee with big ideas enters the market, he gets truly rogered.

This will make sense to me. Can you imagine an expert on TA giving you a book for £50 and once you have read it you are fully kitted up to shaft the market makers and spread betting companies. We only get half the tool box and the small hand held drill. The big boys get the big tool box and the drill that tears up tarmac. So, what I am doing now is de-learning what I now know and looking at every thing, be it tick, trin with a fresh pair of eyes and with no pre defined rules.

Do you remenber the Matrix.
Andy
 
matey - let me tell u something - I am a pro myself - traded OTC and proprietary options on UK techs first and US indices and individual stocks afterwards. Hold no respect - and I mean it - for the pros - all u need 2 do as a pro is to get pissed up with the right guvs and listen to what they say - then u jump on the client flow and it's yr happy days.

And - me being an x-pro and knowing that the only thing u need to know is where the client flow is - the Tick is the ONLY publicly available measurement of the but/sell flow. I may be cocking up from time to time - apologies if I ever give out confusing posts - but i do not ever want to trade on anything else......

anyway my motor here in mexico got towed away since I parked on the wrong side of the flow :) luckily I wasn't there - as pissed as i am I'd be hanging about mexican convicts for the rest of the w/e :) totally off-topic - my apologies! and God Save The Queen on this glorious RWC day! I am shutting up here. Good w/e to all!
 
Tick, does this make sense

CW

I understand your problem with absolute levels on tick signifying market direction. I agree that a blind statement of say 500 to 800 being bullish is misleading. However, I have another slant on this. What I think we need to be doing is looking at the the highest high or lowest low on the day then look for tick lows or highs that correspond to the two minute ema.

If you look at the attached chart, (sorry Rossored), the blue arrows are all fanning out from a tick low, however every subsequent tick low is in fact making a HL tick. This signifies to me lack of conviction in new shorts. There are two black arrows. On this occasion, we had bear flag rather than new up trends. It is interesting here that here the ema failed to break beneath the zero line. I am not sure if this has significance. The red arrow signified lower tick and lower ema therefore a lack of bullish momentum.

The two green arrows are interesting. On A, we had a slightly LL tick and ema but they were still up on the days low. All I can see here is a series of falling bottoms and tops in a concentrated area. This signifies to me, Strong downward pressure. Now, this is in hindsight but maybe this important.

With B, we have a recent HH tick and ema that is below the days tick and ema high. Here we have rising bottoms. Bullish significance. Maybe??

Anyway, tell me what you think. I am going to look at the trin as this seems a better trending tool. Also, I am going to look at smaller and larger tick time scales to see if they give any more clues. Also, at some stage, we need to write this up. This week has been good. I have learnt a lot.
Cheers
Andy
 

Attachments

  • dow 5min116.png
    dow 5min116.png
    24.9 KB · Views: 386
Last edited:
China,

Jesus mate, 3 losing trades in 3 months and you are worried about 1 glitch where there is no div prior to a pullback. Get over it ;).

Don't know that I can add anything at all to the analysis that you have gone through yourself with regard to the 13:15 "glitch".

All I can say is that looking at the prem (or e-prem since my large contract data is a bit screwed at the moment), the futures were bid up just enough at 13:18 to kick off a buy program. The whole move from from 12:40 through till 14:15 looks to have been "led" by the futures. Perhaps it's just asking too much for TICK to show its customary divergence on a move that was almost entirely engineered on the s&p floor.

Stoploss,

Couldn't get to that AOL site unfortunately. I can probably guess what is on there anyway but it would have been interesting to have a look.

Some interesting posts that you've put together here. Couple of things I would comment on.

Where you say : "Now, the way I view that absolute tick value for the 21/11 is that the value of advancing shares against declining shares could not get over 515 on four occasions were three of the approaches were turned back at that red Resistance level in the tick". You probably know this anyway but just in case. TICK is net of the number of NYSE stocks who's last tick was up vs the number who's last tick was down. A subtle difference between advancers and decliners, but of vital importance nevertheless.

That being the case, absolute numbers on the TICK have less significance, particularly with regard to drawing conclusions about support and resistance levels. Given it's only the LAST tick it's impossible to sensibly use TICK in the way in which you are trying (although I applaud your attempt to understand it in more detail).
I know this may be confusing given that I've said that I use absolute values of TICK. I'll try and expand on that here to clear up any confusion.

OK. So, rather than looking at indicators derived from price, you are now looking at statistics that show you market characteristics. These can all be useful it's just that some are more useful in certain contexts, timeframes.

Firstly, you have market characteristics that may (imo) prove more useful to give you an overall feeling of the tone/sentiment of the market and provide confirmation of the validity of a trade once you are in but are very difficult to use to refine trade entry. Amongst these I would list:

1) TRIN
2) Advancing Issues/Declining Issues
3) Put/Call Ratio
4) VIX

Secondly, you have those statistics that can provide you with information relating to market tone/sentiment but prove more useful (imo) in helping you to identify or refine trade entry/exit. The most important of these are:

1) TICK
2) PREM (difference between futures and cash).

PREM shows you when certain types of buy/sell program will hit the market. TICK shows you when most program trades have hit the market. Knowing what happens in the market before/during/after program trades is a key edge that you can equip yourself with btw.

So, when I said that I use absolute values of TICK (or more precisely 0,+300,+600+,+1200 and the corresponding negative values what did I mean?

At its simplest level: If I want to go long the S&P (because of price movement, patterns, whatever, then I won't do it unless the TICK is less than +300. Ideally if there is an upward trend and I'm looking for continuation to add contracts then I'll look for TICK to hit zero and then look for the S&P to set-up the way I like it for entry. This obviously works in reverse for shorts.

The nature of TICK means that +1200 or -1200 values tend to be climactic/washout moves simply because it's "unusual" for 1200+ stocks on the NYSE all to uptick at the same time (although as China says you can't simply sell every time TICK reaches +1200). What I do, is make a judgement about how it got to +1200 (or -1200). If it's a climactic type move that looks like a series of buy programs hitting then I'm almost certain to fade it. If there have been sustained tick levels between +600 and +900 and then TICK hits +1200 then I'm almost certainly not going to fade it.

The same thing applies to +900, i.e. if their have been sustained tick level between +300 and +600 then I wouldn't fade a +900 TICK move. But again, if it looks climactic, with a series of buy programs hitting to get TICK to +900 then fading that level represents a low risk entry (imo).

On a patchy type day, I might also fade tests of TICK HOD/LOD. This largely depends on whether there is S/R on the S&P to support such a trade.

With regards to the 13:15 short on Friday, it had several things going for it.

1) Pivot formed potential resistance on S&P.
2) A series of buy programs hit, the last of which looked to be "engineered" by a the S&P pit bidding up the futures.
3) As well +900 TICK, the level also represented a test of HOD.

Bit of a ramble I'm afraid. Hope it helps.
 
Andy - very good analysis!

Imo the only thing u r a bit neglecting - is that Tick's Highs and Lows matter only in relation to corresponding ES's Highs/Lows.

Let me give u an example. Say, Tick recorded an extreme reading below -1000 and then a higher low say at -800. This is mprotant ONLY if ES on the 2nd low recorded a lower low. If ES also made a higher low - that probably means that the selling pressure is not finished, it is a bear flag, and u may well c another leg down with its own selling climax.

this is the whole concept of divergencies at the market turns innit? :)
 
Sandpiper

Here is that link again. I had just finished a long reply to both you and China but not sure what I did but managed to erase it.

http://www.activetradermag.com/special/cyberterryapril.htm

Thanks for your detailed reply. More info to chew on. I have decided that I am going to concentrate on the Tick and I can now see its merits over the Trin. I will however continue to post my findings of the Trin daily purely because I want to understand it completely. I can see where you are comiing from. My analysis of the Trin shows that it FOLLOWS the Tick on a trending day while on a day like friday, it can be really hard to read. The Tick is the leading indicator and therefore, my concentration should be there during trading hours.

On the 13.15 fade out, I think we are looking at this from the same angle but please correct me if I am not. What I am trying to do is define the tick range of the day together with the nature of its movement. If we have say a range of +/-300 and a nice wave pattern, I will be surprised to see a spike to +1200. If this where to happen, any additional new longs would have to have a strong case. I suppose there would be two tac tics. One play the long retracement or two, short it when the ES give you the opportunity such as happened on Friday.

You also mention the zero line. This is also mentioned in the link. Do you view this more as a psychological level were in an uptrend, the baton has been passed backed to the bulls after we have just made a HL and also a self full filling prophecy because every one who uses the tick will enter there.

On the PREM, I have this but was never sure what it actually meant. Would you use the same kind of tactics as used with the tick or is this read in another way.

CW

Got it. That bear flag looks a lot more obvious now.

LL Tick/LL Tick MACD/ LL ES MACD/LL ES/LL EMA Tick, not V good.

I am going to make a list of possible set ups for tops, bottoms and bull and bear consolidations. Not going to do it now as it's late and I need my beauty sleep. However, before I sign out, I am finding the MACD ES more reliable than the MACD Tick.

Thank you all for your help.

Regards
Andy
 
Last edited:
Status
Not open for further replies.
Top