Trading the ES (E mini S&P) November 2003

Status
Not open for further replies.
Stoploss,

"What I am trying to do is define the tick range of the day together with the nature of its movement. If we have say a range of +/-300 and a nice wave pattern, I will be surprised to see a spike to +1200. If this where to happen, any additional new longs would have to have a strong case. I suppose there would be two tac tics. One play the long retracement or two, short it when the ES give you the opportunity such as happened on Friday".

For me, a sustained range of +/-300 would be indecisive. A spike to +1200 would indeed be a surprise as it would usually take quite a series of buy programs kicking in to make that kind of move. In order to assess whether new longs have a strong case you have to make an assessment about the nature of the move, i.e. is it the cash market or the futures making the move. A sustained period of TICK readings between +/-300 just doesn't indicate an level of committment in the cash. As such I'd fade the +1200 move and short (jmho).

"Zero line, self fullfilling prophecy". Got it in one. If it's used by large traders (and it is) and it works (and it does) then I use it too. Again you can't just fade every retrace to the zero line. It has to be in the context of the overall market move, i.e. a period of 30/45 mins or so of TICK readings between +300 and +900 followed by a retrace of TICK to the zero line presents a good opportunity (as long as their hasn't been a climactic/exhaustive move in the TICK prior to the retrace).

PREM represents the premium or discount at which futures are trading over/under the cash. If you google it you'll find various sites that explain the concept of fair value (FV) so I won't go into that in too much detail 'cos it's just dull..... ;).

As a brief explanation:

If the difference between the futures and cash prices moves too far away from fair value then trading programs kick in to restore fair value (a form of arbitrage). So if the futures price is trading at too much of a premium or not enough of a discount to the cash price, trading programs kick in to sell futures and buy baskets of stocks (and vice versa to buy futures and sell the cash).

If you know what fair value is every day and you watch PREM, based on what the market is doing at the time, you can make a fair deduction as to whether the futures or the cash is making the real move.

If you know (or can work out from TICK) the levels at which buy and sell programs kick in you can work out what is going to happen next on the futures (hence your edge).

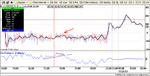
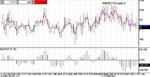
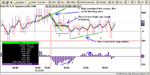
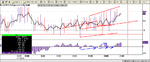
On Friday the PREM showed the futures bid up to a level where they were sufficiently over priced in comparison to the cash to warrant the execution of program trades. These trades involved selling the futures and buying the cash. If you look on a 1 minute chart (just for the sake of reference) you can see the S&P futures drop but the S&P 500 cash (and the TICK) rise.

As I mentioned, prior to this "climax" there was a period from about 12:40 where the futures and cash were both moving up and the futures were trading at less of a discount to the cash than fair value dictated. To me, this indicated a move engineered by the pit. Such a move up to a floor traders pivot.... with a corresponding climactic TICK move to the high of that day.... you can draw your own conclusions.

Anyway, I'll leave you to look up research fair value and program trading and put them together for yourself.

When you are looking at TICK just bear in mind that it is only a leading indicator if the cash market is in control (imo). If the futures market has the reigns then it's a representation of cash market activity but it's still lagging.

More apologies to Rossored for extending this traded beyond ot's sell by date......... ;).
 
Last edited:
Sandpiper,

that is it - u hv it nailed. it was a complete and utter futures spike and of coz u can't expect Tick which is a CASH buy/sell intensity measure to show any divs there.

matey - apart from Bloomberg - to which I hvnt got access at the mo - can u recommend any source for real-time display of futs premium to FV? cheers mate
 
China,

Q-Charts used to show prem and e-prem (e-mini minus cash) and I see you use them anyway. They always used to have problems with it on futures expiry. Don't know if they still do. Anyway, you could always just put the expression, futures - cash (or cash - futures at the moment) in yourself.

If you are on about Fair Value (which I suspect you are) programtrading.com used to be the best source but I thinks it's all pay now. IndexArb.com is one that I look at now (think it was someone on here that pointed me to it).

Don't think there is that much advantage in a real-time source for fair value. Although it does change slightly during the day it's not that big a deal.
 
Last edited:
Hi CW

You said

"still a bit suspicious - since anyway u start tagging yrself to a particular number on Tick - which I believe has no relevance" -

Where I was going wrong is that I was looking at the tick as one would look at advances compared to decliners. However, the whole market could be down on the day but we could still have a rising tick. What I am getting from both you guys is that the tick value can not be looked in isolation but as Sandpiper said

"you have t make an assessment of the nature of the move".

ie, look at what has happened in the recent past and see if there any clues to what is going to happen in the future by looking at things like you ES chart, your tick and now, thanks Sandpiper, the Prem.

Going back to the tick and our discussions last week concerning my applications of trend line breaks to the ema and and HL, LH ema. I still think we have something here but yet again this has to be put in context of the wider market. How did you get on with it over the weekend. I back tested the ES MACD against the ES Tick and found the ES MACD easier to read.

At the start of last week, the tick was new to me but as I have used it, I am beginning to understand its nature. It is a strange little beast but it will definitely give me an advantage once I have learnt cope with its delicate mood.

Sandpiper

You have given me a lot more stuff to chew on. There was I on Friday, thinking to myself, is that it however now I am thinking, shite, more head scratching.

Thanks again for your input. Need to go away again and think some more.

Cheers
Andy
 
FHH is in

looks like the tops in at the mo, wonderful discussions last week and w/e . I still like CCI + MACD n/c 1min 5 and 30..

Does anyone know why we cant post more than one graph?

Rgds
 
Prem

Sandpiper

I brought up the Prem for the 21/11. I think I can see on the one minute chart the problem area but to be honest, I doubt very much I would have spotted it at the time. Anyway, I have gone to the five minute time scale and also added an OBV indicator to it. This is the first time I have ever look at Prem or OBV so I maybe barking up the wrong tree. Anyway, the OBV shows consecutive LHs followed I a trend line break. Is this a set up that will give me a rudementary understanding of the Prem.

Cheers
Andy
 

Attachments

  • dow 5min117.png
    dow 5min117.png
    18.9 KB · Views: 349
Stoploss,

Not really. Although different things work for different people. I'll put a chart up over US lunch-time to show you what I mean.
 
fading tick extremes

a perfect example of how fading tick extremes can put u in trouble on a strong trending day :D

sandpiper - good site, many thx

stoploss - y of coz, Tick dynamics matters ONLY against price movements. U cannot trade just looking at Tick chart - the whole point is Tick divergencies against ES.
 

Attachments

  • tick2411.jpg
    tick2411.jpg
    40 KB · Views: 334
Stoploss,

OK. The chart I have attached is E-PREM 1 minute (or me using e-mini minus cash since I dont have E-PREM/PREM).

As you can see, it's a basic line (close only) chart with a 100 ema and 100 period bollinger added. I don't use the ema or the bollinger bands for anything. I find they just help me apply context/scale to the movement of prem.

I've drawn a line roughly where fair value was on Friday. This is the most important reference point.

I've also added two circles, one to show the start of the move we were talking about, the second showing the "climax".

I'm not bothered about HH/HL/LH/LL(s) on the prem. The main thing I want to know are the futures trading above or below fair value? And, with regards to recent history, have they been trading above fair value for a sustained period.

When I put that together with the direction of the futures and the cash I can make a fair guess as to whether the cash market or the futures market is behind any move.

Why? Because, in general terms, I won't fade a move in the cash but I will seriously consider fading a move in the futures that isn't supported by the cash.

Hey, talk of the devil... The opening 45 minutes this morning provide a good example of what I was saying last night with respect to TICK. A sustained period of TICK readings between +600 and +1200. Fade the +1200? No. Why? Because of the sustained high readings + it was a strong move in the cash market. Following the period of TICK readings between +600 - +1200 there were two retracements to 0 TICK, both of which provided reasonable entry points for longs. Not spectacular results, but hey you get what the market gives you.
 

Attachments

  • prem 1m chart gif.gif
    prem 1m chart gif.gif
    16.1 KB · Views: 325
Last edited:
Stoploss,

Just an idea. But if you are going to have TICK up (with China's MACD), possibly your TRIN and maybe even PREM then things are going to to start getting a little congested, not to mention confusing.

As I've said, I really don't care about HH/HL(s) etc, on anything other than the futures and the cash (and I'm not even too bothered about the cash). I focus on price patterns/movements on the ES,YM and NQ. I do however like me TICK and want it on screen. However, I want to be able to glance at it and get a "picture" straight away, without analysing it too much.

With that in mind I use a sort of "area chart" shown below.

It might be a way for you look at TICK (with MACD) without distracting from your ES pattarn analysis.
 

Attachments

  • tick 1m chart gif.gif
    tick 1m chart gif.gif
    17.5 KB · Views: 326
Trin, Tick and Prem

Sandpiper

The trin is well and truly ditched. Sensor overload. I am getting to grips with the Prem but I probalby need to work out the Tick first. One question with your Prem chart, is it log scale or Arithmetic.

Sandpiper and China

I just want to make sure what I have learnt since Friday has been applied correctly on the below chart.

1. Sustained high Tick levels so not a good shorting area and low possibility of fading.

2. LHs and break. I would have viewed this on Friday as a shorting opportunity as we had an ES / Tick divergence. There were a couple of points to be taken but the factors against shorting were points 3 and 4 being.

3. Tick finding support at zero. Does that have relevance?

4. Rising Tick MACD. We also had a neutral ES MACD.

5. Long opportunities at Tick zero line recrosses and the Tick and EMA are rising.

We also had on the ES a hammer, bullish belt hold and doji star at 1046 giving support. I think these are the names for these. What ever they are, they look bullish. We also had goodish volume on the middle one.

Cheers
Andy
 

Attachments

  • dow 5min119.png
    dow 5min119.png
    22.8 KB · Views: 348
Last edited:
Tick, 24/11 part two

Hi

All I can see here is solid but slow upward momentum.
 

Attachments

  • dow 5min120.png
    dow 5min120.png
    19.4 KB · Views: 317
Stoploss,

In answer to your questions:

1) Correct (imo).

2) Yes (again imo). There were several zero "bounces"/ Plus, TICK never retraced to more than -300. I regard anywhere between 0 and -300 as "support" (if you want to call it that). In an up move.

4) Don't know. Don't watch it (at least not yet.... ;)).

5) Not so bothered about Zero crosses. As I say, I regard 0 to -300 as support, i.e. if I'd gone long on a TICK retracement to zero and TICK then dropped past -300 I would be trying to scratch the trade if I could.

6) Don't know. Can't say I look at candlestick patterns apart from the more obvious ones that everyone knows, i.e. dojis and bullish/bearish engulfing.

With regards to the PREM scale. It's just arithmetic.

Regarding the day and TICK. There was never a TICK reading below -300 in the day. There were two turns in the 1 minute TICK 200 ema 10:30 and 12:30. There was what looked like a buy program just prior to 13:30 with the inevitable TICK -300/LOD retracement. The action before that 13:15 move wasn't fade material though (quite the opposite) since it didn't look climactic and it was a cash based move rather than futures based. Apart from that there wasn't much worth mentioning. No obvious moves in the futures to hit index arbitrage program trading levels.

Oh, the other thing about PREM, before I forget. I view it in much the same way as Grey1 views his VWAP. That's to say, if nothing else, I want to be entering longs on the futures when they are priced below fair value and vice versa, i.e. don't enter a long when PREM is above fair value, don't enter a short when PREM is below fair value. It's a small thing, but why put up with an inevitable retracement of price after you enter if you don't have to.

Just missed your last post there. Well all you should see is upward momentum. There is nothing else to see..... ;), so that's GOOD. At 14:57 there was a TICK 0 retracement off the back of solid positive TICK levels (+300/+600) that had been sustained for 90 minutes. Perfect for a long time-wise (you would expect a breather after 90 mins), and perfect TICK level (0). Only thing going against it was the fact that it was just before 15:00. All that means is you keep a close eye on it.
 
Last edited:
Sandpiper

Interesting that you view -300 as support on an uptrend. Would you have resistance at zero on a down trend because prices fall quicker and rise slower. I also like your strategy of dealing with zero cross over longs.

I have the LOD as -407 at 11.20. I am not sure if it has that much relevance. The only thing it did was put in the LOD. I suppose to me it is a point that gives me some perspective on the rest of the days action.

The 13.15 ES LOD looks like a reverse fade out if there is such a thing on the tick. It open at 655 and closed at -333 on my five minute chart. The next tick bar powered up above zero. This now looks bullish to me where as before, just looking at the price data, I would still be unsure.

Back to looking at the Prem

Thanks again
Andy
 
Stoploss,

No, I'd have resistance at 0 to +300 'cos I'm not that clever... ;). Same things as before I'd look to short at TICK 0 and wouldn;t get worried if TICK moved up to +300 as long as there wasn't any development at that level.

I guess your LOD is correct (since I'm using MyCrap). I have it as -372 (so yes, below -300,albeit fleeting) at the same time as you. You are right only thing it did was put some perspective on the day. I'm not too bothered about precise levels, i.e. +300, -300, as I say as long as there is immediate rejection of that TICK "area".

"Reverse fade out". Maybe, as good a name as anything for it. I don't really know what happended there. It just stood out as an interesting 15 minutes. Now I look at it im more detail, you are right it actually looks like a sell program that took the TICK down to -333. Anyway, point is with TICK <=0 and >= 300, PREM < fair value and the e-mini retracing to 1046.25 (the mid-session low) it certainly looked like a retracement in an upmove rather than the start of a reversal to me too and was traded accordingly.

Only thing I was mindful of with that trade was the likelyhood of there being sell stops under 1046.25. But going long with prem < fair value meant there was some margin for error on the trade.
 
hillbillie,

Sorry. Missed your post there. You could post more than one chart if you wanted just by "cutting" and "pasting" the charts together to form a single attachment in paint I suppose. As for the one attachment per post... I don't know why.
 
24-11

lads,

u'll be a bit surprised - but per our system Tick does not matter on such days! :)

If indices (cash) break thru 240 ema and 600 ema/5min (20 ema and 50 ema/1 hour) on the gap or shortly after the open, with sox leading naz, naz leading dow and bix leading spx - it is a Bear Ugly (or Bull Gorgeous :) ) day and u just buy the upper (sell the lower) 1st hour pivot on the dip/spike when u get a chance to do so of coz :)

U check if the internals r still Gorgeous or Ugly :) at time pivots of 13:00 and 14:15, and if so, u essentially buy any dip (sell any spike) into the close.

I NEVER go S on a Bull Gorgeous day. Even if I get Tick neg sequence, I use it to get a better L entry.

Btw, per Tick analysis, there'd be one L entry today @ 12:15.
 

Attachments

  • tick2411.jpg
    tick2411.jpg
    37.6 KB · Views: 254
Your long entry

CW

Just looking at your long. Now your system looks for
LL Tick/HL TICK MACD/HL ES MACD/LL ES/HL TICK. We also had a few zero tick recrosses and rising EMA bottoms.

I have drawn three trend lines linking the the tops of the falling EMAs.I just want to analize each one to see their merits.

A. No HL tick/ ES MACD.

B. Here the ES was rising.

C. All criteria met.
 

Attachments

  • dow 5min121.png
    dow 5min121.png
    21.7 KB · Views: 255
CW

with sox leading naz, naz leading dow and bix leading spx

Now, that is interesting. Any more little gems like that will be great.

Cheers mate
 
perfect observation - C is of coz a stronger point of L entry - however, do not forget that i am fiddling with ES MACD at the mo - it's not (yet!) part of the system. Per system it is Tick macd vs. Tick followed by Tick vs. ES :)

many thx for yr comment. never forget about the price action - when the internals r so strong and 240 and 600 emas r taken out str8 away - all S r getting flushed out, do u ever want to be S on such a day? :)
 
Status
Not open for further replies.
Top