Trading the ES (E mini S&P) November 2003

Status
Not open for further replies.
For the bulls

Here may be are the counter arguments however, they are a lot less developed. Before anyone has a go at me, no, I will not be charging in the future.
 

Attachments

  • dow 5min101.png
    dow 5min101.png
    25.4 KB · Views: 364
China,

I see where you are coming from on TICK when you are looking at momentum. Thanks for the explanation. Most illuminating. I'll be giving it a more detailed look this W/E.

Should have been clearer in my post actually. When I said hindrance, I meant it's more usual interpretation, i.e. fading tick highs/lows and using the -1200,-600,-300,0,+300,+600,+1200 levels. I can kind of see how that was not the case with the way you use it.

Once again, thanks for the explanation.
 
13:00 pivot on 21-11

So far -

Long entry @ 31 on penetration of 1st hr lower pivot - a whisker away from proper tick + div as ES did not make a lower low - but given internals reasonable.

Rev to S @ 35.5 on clear macd - followed by tick - div

Recent Rev to L @ 33 on the same + sequence.

We'llc now
 

Attachments

  • tick2111.jpg
    tick2111.jpg
    40.1 KB · Views: 344
stoploss,

a quickie - i do not think u shud me using volume-averaged MAs on TRIN for the simple reason that TRIN is by definition already volume-weighed. i am afraid it may make things worse.

sandpiper

thx for the msg. I NEVER look at absolute values of Tick (unless it's a complete and utter extreme). Personally I think that's the biggest blunder one can make trading on Tick. It's only divergencies that I am after :)

cheers lads for yr comments. back to battlefield :)
 
CW

I am finding the MAs confusing but today being rather bitty has not hekped. Just using peak and trough analysis together with trendlines seems to work better. I will post it later on.

Andy
 
Have to run now - will post later. Thez 1 interesting thing which I hvnt yet sussed in the system I am using - will make food for thot for sure. And today @ 13:15 there was the best demonstration of that bit ever. later
 
Trin 21/11

Today was a really messy day. This is shown by the trin. I got very few rising and falling peaks and troughs so what I looked for was trend line breaks. The first hour, the trin was unreadable however when it market settled into its trading range, things became easier. I initially started off with a 5min chart and the 20 and 40 emas however I soon found that this time scale too slow and the emas to me gave little value. Maybe China White will have a different interpretation. I therefore dropped down to the three minute time scale and found I could recognise patterns much easier. Here is afternoons action. I will post the evenings findings in a mo.
 

Attachments

  • dow 5min103.png
    dow 5min103.png
    29.5 KB · Views: 318
Today was also options expiry day. A day to go and play golf perhaps :)
 
Trin part deux

Evening session was basically a pile of pants. The Trin generate 5 trades with 3 small winners and two loosers. I would say you would have to be really nimble to have made money in this part of the day.
 

Attachments

  • dow 5min104.png
    dow 5min104.png
    24.8 KB · Views: 323
Tick

CW

With the Tick, all I am looking at right now is trend line breaks, hopefully around S&R and when it coincides with the right pattern set up and Trin confirmation. I still have not really sussed out your system however I once I have mastered it, I believe it will help me avoid the bad trades.
 

Attachments

  • dow 5min105.png
    dow 5min105.png
    28.2 KB · Views: 289
21/11 chart

Today being a tad messy, I spent all day looking at support and resistance . We initially gapped up and tried to break up above 1037. 1036 was seen as todays pivot and with the ES not been able to sustain itself above this level, the market took on a bearish out look. The gap filled and at 1 we made a lower high. After that, we were heading down. I heard calls at the time of a possibilty of 1026 however 1030 held and at 2 we had our reversal. We could not break 1036 and at 3, the bears once again took the initiative. At 4 I was not sure if we had a bear flag or a change of trend after a HL. The Tick and Trin was also hard to read today. Anyway, if I could read which way every congestion area would break, we would be millionaires this time next year Rodney. I suppose a long candidate was in the offing after 4s move but I was eating pizza. This brief rally did come off the low of two days ago so I am sure some of you out there took it. 5 was an easy short after another failure to sustain itself above 1037 and 6 was another good short beneath the up trend line. At 7 we had a basing and a good up move after that move I am not sure what happened.
 

Attachments

  • dow 5min109.png
    dow 5min109.png
    21.9 KB · Views: 302
China,

"Biggest blunder one can make".... ;). Don't you sit on the fence now... ;)

Well like most things if you look at 'em long and hard enough they tell you a story. Zero TICK bounces are as good now as they ever were as are some of the more basic TICK rules. You're right in one respect, i.e. fading tick extremes or tick/price divs can be hard work these days (although that's probably more to do with me being tired of that type of trading). Still, like I said, always prepared to learn something new so I'll have a look a this momentum idea.

Stoploss,

Was always going to be that kind of day in fairness.

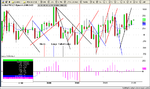
The wonders of TRIN eh? A good day for illustrating the point we were discussing though, so I'm kind of glad it came up. The reason the TRIN was "bitty" today is because of the underlying. Bit difficult for me to analyse preperly because MyCrap doesn't have decent volume data. However looking elsewhere for the info, TRIN was showing a fairly lacklustre underlying with advancers only just outnumbering decliners for most of the day (3:2) and likewise with regards to volume.

So, given that we said that it's the "velocity" and direction of TRIN that matter, the fact that you had to reduce your timeframe to get any kind of idea on TRIN movement probably signals thats it's time to stand aside.

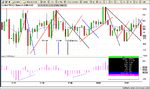
Given the likelihood for this kind of day, for me there were were a couple of trades in the first 90 minutes. 1 in the last 90 minutes and the TICK climax fade off the pivot at 13:15.

TICK (on a more basic level than China's observations) showed the same thing as TRIN for most of the day once the first hour was out of the way, i.e. there just wasn't the necessary weakness in the cash to support a serious challenge on YD low and take it out.

There was certainly more to be extracted from the day for the young and nimble. But, once again, as China quite rightly says, the nature of TRIN just isn't going to support this approach.

As you seem to be discovering though, TRIN can be useful, providing you don't expect to catch every single move the day has to offer.

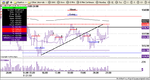
I actually watched TRIN (for the first time in three years....) today just for interest. It was enough to remind myself of why I don't use it any more. Futures led TRIN significantly on every (and I mean every) single move today. And as you noticed, there were a couple of "false" TRIN moves as well, the worst of which was at 13:30 when the move on TRIN falsely indicated a move up through the pivot on the futures (in fairness it reversed the bar afterwards).
 
Last edited:
Sandpiper

I get your point. I great little tool in a trending market but it looses it a bit as soon as we get really range bound. I want to stick with it purely because it give me another string to my bow however it cannot be relied upon to generate your entry and exit triggers. Confirmation is required. Which means this weekend, after England stuffs the Aussies, going to break down the Tick.
The one thing I would say about the Trin is I feel more confident in hitting the bottom with it then instead using indicators like RSI or Stochastics.

Cheers
Andy
 
Status
Not open for further replies.
Top