Trading the ES (E mini S&P) November 2003

Status
Not open for further replies.
Stoploss,

TRIN eh? ;).

Used to look at it up until about 3 years ago. There are obviously a variety of ways of using it (even for positional trading with TRIN climaxes).

The reason that I stopped using it is that it can represent quite a distorted view of whats happening. It obviously relates advancing volume/declining volume to number of advancers/decliners. However on days where ther is large volume in a few large cap stocks trin can get you in real trouble.

I found that on the easy straight up/straight down days with broad based rallies or declines, TRIN provides great confirmation. On the hard days where the market is mixed (which is where we all need the help) TRIN can be a nightmare.

For anyone that tries to use it I would suggest having an advance/decline + advance/decline volume chart up beside it. Watch them together until you understand TRINs limitations.
 
Sandpiper

Yesterdays Trin did look a bit too easy. Were can I get the advance/decline + advance/decline volume chart.

Cheers
Andy
 
Stoploss,

For you on e-signal it's:

($ADV (Advancers)/ $DECL (Decliners)) / ($UVOL (Up Volume) / $DVOL (Down Volume)). This is the TRIN or Richard Arms formulae as you know.

So, I would suggest that you chart ($ADV/$DECL) and ($UVOL/$DVOL) as well as TRIN.

Nothing wrong with using TRIN providing you can develop an understanding of why it moves the way it does. Personally, given that there are only so many things you can watch, I continue to find TICK more useful. But if you can get something out of TRIN good luck to you.
 
Nice inverse H&S.
 

Attachments

  • 19.11 es.gif
    19.11 es.gif
    23.7 KB · Views: 276
Todays Trin

Nice chart Bigbusiness. Nice how we ended up at 1043. That always looked like good resistance today.

Still getting to grips with the Trin which stopped me trading today. That big spike down on the Trin at the start of the day really confused me. It also, seemed to screw up my chart and made it hard to read. It started at 3.64 and ended at 1.11.

I suppose the initial upside momentum should have been expected but that is easily said in hindsight and I am still very green around the ears to take advantage of such a set up when it happens. For the next hour and a half the Trin was above one but was confined in a tight rectangle. At the same time the bottom of the bars seem to be basing higher. I therefore began to look for a shorting opportunity.I hoped that this would be around the 1037/9 area. This being the area of resistance and also by chance the pivot. When the Trin finally broke up above the horizontal red line, the price did slip but by only a couple of points.

The rest of the day, the Trin made a series of lower highs five times. On the first three, some good longs could have been taken.
The last too I have marked A and B. The Trin became a bit more congested. I think the major factor here was we were at the 1043 area. This area was always going to be a hard area to break through.
 

Attachments

  • dow 5min89.png
    dow 5min89.png
    23.7 KB · Views: 270
ES 19/10

Looks like three longs and one short. I think today was messy but many of you will probably disagree. The the first two entries would not have amounted to much however the third entry being the second long was after a nice seven bar basing all be it after a lower high. The Trin was the saviour here as it pointed the way. The final long was on good volume and produced the most points.
It tried to get through 1043.75 but try as it could, it was a bit of a brick wall.

A bit off the subject, I read in Nison that the Japanese view the number three as being important. The ES bounced off 1043.75 three times. Would that be bearish?? :rolleyes:
 

Attachments

  • dow 5min90.png
    dow 5min90.png
    25.7 KB · Views: 257
Tick vs Trin

Stoploss,

hope u dont mind me butting in with my comment here :cheesy: I stopped using TRIN altogether - and I'll tell u my reason for it. Unlike TICK which measures buy/sell intensity NOW, TRIN incorporates stats since the beginning of the session, and as such is ANOTHER AVERAGE, same league as say, market internals. Hence, it takes a much sharper eye :cheesy: to filter out intraday reversals.

Compare e.g. your TRIN chart of 18-11 with the following chart of TICK. The 1st short @ 38.50 is not "suggested" by TRIN (at least I cannot c it) but fully supported by TICK divs (at upper 1st hour pivot). Then, 2 "golden" chances to reverse at about 36.50 (12:09 and 13:15) and buy the upper pivot into the close are clear thru TICK divs - but blimey - I am either blind or it is rather hard to sift them from TRIN readings :confused:

However, there is one thing which I wud personally develop if I was a better programmer. If I cud modify TICK in one of the 2 following ways:

1) - weigh every stock's tick by actual volume traded on that tick

OR -

2) - weigh every stock's tick by stock's cap (so GE's uptick weighs more than some obscure stock's downtick)

I'm sure I'd have an "earner".

Just an idea. If any1 of u lads/lasses actually does it - pls include me in your Nobel Prize speech :LOL:
 

Attachments

  • tick1911.jpg
    tick1911.jpg
    39.5 KB · Views: 240
StopLoss- have you ever stopped to consider just how important "3" is? It's amazing. :cheesy:
 
No, I'm talking about how many times "3" comes into things... triple top/ bottom, 3 pk ND/PD, eliott waves, 3 parts of the H&S and so on.The dow magic numbers split 100 into 1/3 and 2/3....
 
Cheers mate :) of coz it is perhaps one single most important number. As recognised by Signor Fibonacci back in the 12th century! lol
 
Chartman

Well, lucky I brought it up then...................... Not all the members on this forum know of its importance as the levels of experience varies a great deal.

So, are you already short for tomorrow with the big boys. It could be a triple top and you could make a killing.
 
lads/lasses

I am getting quite a few msgs regarding trading on Tick. let me clarify certain issues here. Hope u'll find this useful.

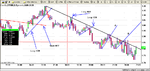
Firstly, yes, my main timeframe is 5 min with its 2 ma (10 min). My "momo" - momentum measurement of tick dynamics - is MACD(5,35,10) which means that during the first 50 min of the session the momo reading is not reliable - and u have to make decisions regarding 1st hour pivots basing only on Tick divs.

2 issues u'll need to understand:

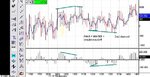
1) - your momo will look slightly different depending on what setting u use for MACD - whether it's measured on "close", "open", "AvgOHLC" etc. The clearest reversals show MACD divs on all settings - but sometimes it is a div on one setting and NADA on others. I personally reckon that AvgOHLC is the most logical setting as it takes 4 measurements in any 5 min bar - so it's the best "average" u can get - and 5 min is a long time sometimes :). U get that setting on QCharts e.g. However, my mate is using Tradematrix and this option is unavailable there - so he sticks with AvgHL. We do get different readings sometimes because of that - but like I said - on major intraday reversals - it is the same.

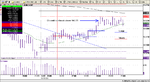
2) - I trade off 5 min, but b4 punching order in I also check 3 min divs. Again om major intraday reversals u get every time frame in sync - when u don't u may want to work a limit order in the 5 min direction usually 0.75 pts better. NEVER follow 3 min momo div if it's not on 5 min scale - this means it's just a scalp for 0.75-1.5 pts.

Regarding absolute values of Tick - I (well 95%) do not care what that is - I am looking for divs to make my trading decisions. An absurd situation - imagine it is 1929 or 1987 - u'll have continuous Tick readings below -1000, so what u'll be buying? :)

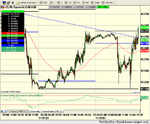
FINAL bit of advice for TRIN traders. U'll be better off watching 20 and 40 mas/5min (100 and 200mas/1min) like hawks :) I am still very sceptical as to the clarity of trading on TRIN - for reasons presented in my previous post - but pls keep me posted. I'd be overkeen to learn how u sharp eyes manage to read it :).
 
Hiya folks
Not traded ES futs for a while (properly anyway) got a FTSE and a Dax open both longs...

ES gave me an entry i liked for various reasons
Entry @ 1044
Stop @ 1041
Raised as i type to 1043.5
 

Attachments

  • es-10m-20-11-03.png
    es-10m-20-11-03.png
    115.4 KB · Views: 346
20-11 after 13:00 pivot

this is where it stands imo now:

2 early tick neg divs at upper 1 hr pivot - on strong internals - S @ 42, cover into major 240 ema/5min sup across indices - 2 punts for 1-1.5 pts each. Waiting for tick + div to stop punting on the S side. 11:40 - tick + div on 240 ema sup => reverse to L @ 40.5 worst.

Now interesting. The only chance for reversal to S is around 14:15 time pivot. We''ll c
 

Attachments

  • tick2011.jpg
    tick2011.jpg
    40.3 KB · Views: 337
stopped out -0.5
re-entered @ 1044 put original stop in place as moved it too early.

off to gym see you guys tom probably

Happy trading
NB
 
Status
Not open for further replies.
Top