Trading the ES (E mini S&P) November 2003

Status
Not open for further replies.
Tick

CW

Am I reading this right. Not sure what I am doing here mate.

Ta
Andy
 

Attachments

  • dow 5min92.png
    dow 5min92.png
    27.9 KB · Views: 336
CW

The Trin has worked a treat today. I will post later on my findings but Tick and Trin together are two great tools.
 
Trin part one

Well, here is the mornings action. What I am looking at is a series of LHs and break downs at the peaks which signal a price up trend. Yet again a little knowledge maybe dangerous here but this has been working so I cannot really knock it. The main thing I would say is it is a tool that should not be used alone.
 

Attachments

  • dow 5min93.png
    dow 5min93.png
    24.3 KB · Views: 313
I am currently developing a strategy to trade the ES and paper
trading it. Attached is a trade that is still open at present and
has made 9 points so far. It is very different to that used by
others but gives another idea for trading.


Paul
 

Attachments

  • es 20th nov1.png
    es 20th nov1.png
    10.8 KB · Views: 315
me "42 carat plonker!"

traded last part of the day as a proper wally :cheesy:

the correct rev time pivot was 13:00 - was clear on my tick radars - just did not c it....

btw - a rather rare situation when since Tick has EQUAL readings u get MACD and Tick divergencies hap'g simultaneously.

take a butcher's at failed simultaneous MACD and Tick + divs right after 14:15 pivot. I went back long at 1041.5 - once divergence was negated - reverse to short at 1040.5

up to 19 easy pts on the table. and that's why i call it trading like a wally :cheesy:
 

Attachments

  • tick2011.jpg
    tick2011.jpg
    39.8 KB · Views: 321
Trin part deux

Well, here we go.

Rising HL and break of its trough signify a negative price trend. CW I can see what you mean about the failure of the old Tick. Does this happen often.
 

Attachments

  • dow 5min94.png
    dow 5min94.png
    21.6 KB · Views: 321
Tick

Another one from the sweet trolley

CW

The divergence on the MACD did concern me but the Trin values looked so bearish together with its upward momentum kept my downside bias.

Would you consider this method as a valid use of the Tick. I am probably breaking all the rules here.

Cheers
Andy
 

Attachments

  • dow 5min96.png
    dow 5min96.png
    18.9 KB · Views: 318
Last edited:
Stoploss,

It's only my opinion, and as such feel free to ignore it ;). But you will get into lots of trouble taking trades in the first 30 mins/hour after the open based on TRIN.

Why, well obviously, you've got the time it takes the futures/cash to converge back to FV through buy/sell programs. Add to that the fact that it takes a while for some of the NYSE stocks to open (with some of the specialists having their own peculiar opening "gambits"). Just got to be careful with it.

You seem to have the right idea with it though. i.e. Many people get obessed about the TRIN level. Of more importance (as you have sussed) is the direction it's moving and how "fast" its moving.

I like your TICK chart. I reckon you could have arrived at the same conclusions without looking at the MACD actually, but hey, everyone has to make their own journey. I'm certainly not knocking China's use of it.

Only thing about using indicators on TICK is that it can (and is) used as an overbought/oversold "indicator" in its own right a lot of the time. If you use indicators on it, some of it's more subtle characteristics may just pass you by and you may spend more time admiring the mantlepiece than poking the fire... as my old man used to say.......
 
ES 20/11

The filling of the gap I suppose is always a possibility. What signalled it too me was the HL on that big long bar. Rossoreds friendly trader on Paltalk also shouted long and that sort of confirmed it for me. The next three longs (A, B, C) were a bit messy but the price congested above the pivot. I know I have said before that I have gone off pivots but I have realised that you need to be flexible. The pivot today clearly gave support. The next move up being D made a HL above the pivot and to me was the most clear cut long of the day. The target was 1045 which was a previous days resistance and also in the region of R1. The price breaking up above and then below this area immediately sends out an alarm. The first short 1 was after a lower high. 2, 3, 4 broke down after consolidations. What was happening on the trin pointed which way they were going to break. After 4 things got messy. I thought we were heading back up tp 1039 but as soon broke down beneath 1034 at 20.45, the what was a reversal became a big flag.
 

Attachments

  • dow 5min97.png
    dow 5min97.png
    28.7 KB · Views: 296
Last edited:
Hi Sandpiper

I am not touching the first half hour at the mo. Not that skilled and there enough points to be taken after 10EST to put a smile on ones face.

Thank you for confirming my use of the trin. My main problem was getting Esignal to show it in a readable way. I think I am going to need more screens though.

Andy
 
Stoploss,

Looking at your ES chart, seems like a pretty good read on the day to me... I take your point on the pivot. fwiw, I find the pivot (caculated using YD Close) less "meaningfull" on gap open days. It helped that co-inciding with todays pivot was the area of s/r provided by YD afternoons swing high(s).

In truth, there were no trades today (unless you were scalping) that didn't beg to be taken just on the basis of price action alone. TICK (unusually) was more hindrance than help and TRIN only told you what price was telling you anyway.
 
trin and its mas

Stoploss,

I am keenly interested. Brilliant analysis of TRIN! U've got a rather sharp eye - that's for sure. I am still quite a bit sceptical, to be honest - just because of the way TRIN averages out the whole session up until the time of its calculation - but I can c it's got something which I've bn overlooking. Let's try to work out what that is.

Imo it makes loads of sense to watch its mas. Primarily 40 ema/5min = 200ema/1min and 20ema/5min = 100ema/1min. Take a look at the past 2 sessions, e.g. - c chart.
 

Attachments

  • trin5min.jpg
    trin5min.jpg
    40.9 KB · Views: 271
Sandpiper,

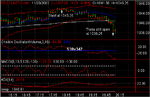
good comments - and much to the point. I am also well aware of the caveats of using indicators on indicators - the only thing I'd like to note here is that I do not believe Tick is an indicator in the exact meaning of that word - it's rather a pure market buy/sell intensity, and as such its momentum can be measured.

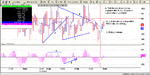
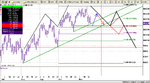
now let me clarify how I use MACD divs. MY IDEAL TRADE ENTRY is MACD of Tick divergence (say, higher MACD of Tick on lower Tick low), FOLLOWED by Tick div against ES (higher Tick lows against lower ES lows). Of coz, if on top of that, u get an extreme reading (below -1000) of Tick on that middle Tick low + u get Naz RSI oversold at the last ES low => BINGO! I hvnt seen a SINGLE occasion when the mrkt wudnt turn on such a set-up.

U can c that I view preceeding MACD of Tick div against Tick as a "head's up" signal, usually serving as a 10 min advance warning of the coming turn in the mrkt.

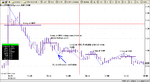
Finally - let me respectfully disagree that Tick was a hindrance in the last session. All major moves: S @ 1042, L @ 1040.5, S @ 1046 into the close were clearly spelt by tick divs. I agree that latest failed Tick + div wud cost u a cupl of points on reversing to L @ 1041.5 and then reversing back to S @ 1040.5, but I'd much rather miss out on a cupl of pts than on a possibility of a late sprint up.

many thx for your comments mate. made me think over a cupl of important pts. much appreciated
 
CW

Brilliant analysis. Cheers mate, all this adulation is going to my head.

MAs ah.

So, would you use the MA cross over to give you market direction with the Trin being beneath both MAs bullish and above both MAs bearish. I would assume you view a cross above the 20MA a change of trend. Would you use the trigger I illustrated.

Cheers
Andy
 
matey - quick answer wud be I don't know - since it's only after u brot TRIN up, I started seriously looking at it! :) I know my mate with whom we developed our trading system, looks at TRIN being above or below 40 ema/5min which I hvnt bn doing. I'll tell u what - best way to suss it - let's "elk test" it over the next say 2 weeks and c what's best.

wicked insights u've got there matey! pls keep up good work.
 
CW

ESignal provide volume weighted averages as well. I am going to use those to see if they make any difference. Why don't you stick to the EMAs. We can then compare results.

Cheers
Andy
 
A bit of fantasy maybe

Back to the old H&S scenarios and also a bit of fun. What is interesting is that the potential troughs are very close to the 38% and 50%. Also, there are three potential areas for the right shoulder. However, on the other hand, the scenario could be that the next wave up makes a HH.Who wants to be an analyst ah??
 

Attachments

  • dow 5min100.png
    dow 5min100.png
    33.5 KB · Views: 242
By the way, the numbers I have on those shoulders are

1055
1043
1027

Yet again, can I stress that I am a newbee so please do not trade off my postings. Do your own analysis.

Cheers
Andy
 
I looked at EMA vs Weighted MA.. and Volume Weighted and Least square.

Came to the conclusion that ema was best - cos I suspect most people trade off it...
 
Status
Not open for further replies.
Top