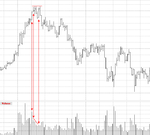
For those who've been following along, with regard to everything you've read since post #69 and particularly with regard to the above post, is the circled area a short or a long?
Well with no context, volume alone will yield no meaningful information (apart from hindsight comments), so we need to set a bit of context to help try to decipher the code:cheesy:.
With regards to Wykoff above - well he doesnt really say much other than the obvious - basically volume = activity! Great, but if we cant grasp who is doing what, and more importantly WHY (which by reading his comments we can never know?) volume and price will not help us understand where price is likely to go next, and in what manner. So yes we know someone is doing something, cool, but WHAT?
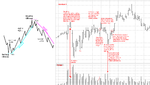
I have no idea the chart or instrument, so will have to gauge context by what happened at the hard LEFT side of the chart.
It appears that we may have come from above on the bigger picture, we can see falling prices at the open being capped (1), and we rise of a double bottom with a decent amount of supply still about (heads up for what may come later).
2 and 3 - retail shorts are starting to get squeezed out of their positions, but if you notice they try to come straight back in.
We then break out above a resistance level, and retail begin to stop and reverse as they see a confirmation of the double bottom, but still no real pro activity, they (the pros) most likely still hold short, but can get a few more contracts on here, but be sure they wont want price moving too much further.
5 . We have another attempt at the high, which is capped (notice the close here - last minute interaction by those with a bit of mula). All this time we are keeping the retail in on the long side - in a hinge/channel. We can use these bad boys on the way down.
6 - Highs of the day - pretty crap volume to say where we are location wise, and once again capped last minute. Final test on low volume, suggesting retail are all in for now, so no reason to go higher from here. But we still need a drop in PRICE to confirm.
We get that, and 7 . Retail start to dump on mass in a textbook stop area location:whistling. So of course there is volume - but what does it tell us. Nothing without the context of the bigger picture and what the pros hold/maybe holding.
So what will they do? Wykoff says you cant know! Ok lets have a stab based on the current theory.
Pros still want lower, the opening volume was pooh, so we need to find volume equivalent to 8, to make this worthwhile for the big boys.
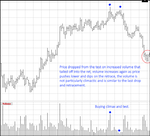
Retail are now seeing a fall and will follow the trend down, bit by bit, until they all come in on mass through the daily lows. Pro business can then be concluded, and if we are still high enough in the daily range, we can begin to make our way back to the upside (but this depends on the daily time frame)
So yes I agree with what the others have said in terms of the short side, but we may bounce a bit from here before working back down (if we indeed actually do
😱)
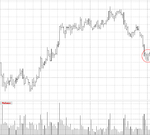
Good Idea DP - can we see the full chart (2 days before and 2 days after?)
Then we all get a chance to learn from current action into forward projection
👍