You are using an out of date browser. It may not display this or other websites correctly.
You should upgrade or use an alternative browser.
You should upgrade or use an alternative browser.
Db can you post a chart please. For those of us not following the NQ specifically but who follow price action trading.
Thanks
Thanks
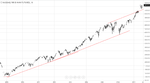
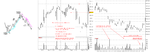
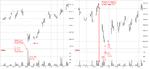
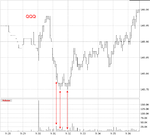
Got within a gnat's eyelash of it. Now we see whether or not we can get past that last swing high at 5852. The fact that price has been hovering around this level since Friday afternoon tells you that it's important.
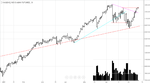
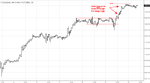
Hello DB, my wyckoff lenses show me something like this;
As to the extent of the up waves, they are a long with very shallow retracements, the duration of the upwaves is also short, showing great result achieved by few hourly buying waves.
Conversely, the most recent downwaves are very short in extent and run for many hours, showing great effort but little result by the sellers.
Wyckoff stresses focusing on the character of the buying and selling waves, is this also what you refer to when you speak of how the market breaks out?
dbphoenix
Guest Author
- Messages
- 6,954
- Likes
- 1,266
The tape is like a moving picture film. Every minute of the day it is demonstrating whether supply or demand is the greater. Prices are constantly showing strength or weakness: strength when buyers predominate and weakness when the offerings overpower the buyers. All the various phases from dullness to activity; from strength to weakness; from depression to boom, and from the top of the market down to the bottom – all these are faithfully recorded on the tape. All these movements, small or great, demonstrate the workings of the Law of Supply and Demand.
-- Richard Wyckoff (clik)
-- Richard Wyckoff (clik)
dbphoenix
Guest Author
- Messages
- 6,954
- Likes
- 1,266
Those who have read Trading Price and the Wycoff Method have a better understanding of what I look for in a chart and of the annotations I make than those who adopt a more standard view of charting. Given the number of people who are following this thread, therefore, it seems appropriate to review just what is meant by "technical analysis" not only as distinct from "fundamental analysis" but also as distinct from all the misinformation that circulates among the trading/investing community about just what technical analysis is and the information it is expected to provide.
A spreadsheet is a record of a company's financial behavior. It may be restated into a P&L or an income statement or whatever, but it usually begins as a spreadsheet. It tells you (or at least is supposed to tell you) where the money is coming from, where it's going, what management is doing with it, how it's being husbanded. A good detective, often an accountant, can tell you with impressive accuracy just what's going on in that company by tracking the flow of money hither and yon.
A chart is a record of a stock's price behavior or, more accurately, the behavior of those who are interested in buying or selling whatever it is that's being traded. It tells you who's interested in buying it, how many buyers there are, what price they're willing to pay (there have been many reasons advanced for the collapse of the Nasdaq in 2000, but the chief reason for the collapse was simply that the market ran out of people dumb enough to pay those prices; when the selling began, there were no buyers left on the field). It also tells you the same things about whatever sellers there may be in the house. But rather than do it with cells in a spreadsheet, it does it with a bar showing the opening price for the day and the low, high, and closing prices for the day. Combined with the number of shares/contracts/etc traded and a knowledge of the psychological and sociological significance of the relationships of these elements to each other, one can reach some pretty accurate conclusions about demand and supply. And since demand is what makes the price go up, this is worth knowing.
That, in its simplest form, is what a chart does, and the purpose of technical analysis is to assess and evaluate this behavior, the behavior of price, the behavior of traders, in order to determine to the best of one's ability the state of the balance between demand and supply. By conducting this assessment and evaluation, it is assumed that one can gain some sense of which camp is in charge, buyers or sellers. Some chartists go beyond this into "patterns", and as long as the link is maintained between what is perceived to be a pattern and the behavior that the pattern is supposed to illustrate (e.g., a "double top"), the pattern can provide a sort of shorthand or tag or hook that enables the trader to make a quicker decision. What happens more often, however, is that the link between the pattern and the behavior the pattern is supposed to illustrate is forgotten, and the pattern is followed doggishly, for no explicable reason, and patterns often degenerate into the silly.
Many chartists ignore behavior entirely and focus on "indicators", forgetting that it is the nature of traders' behavior that the indicators are supposed to indicate. They devote their time and efforts to finding just the right indicator and just the right settings, sometimes for years. But because they ignore the behavioral element, their analysis doesn't work well, or at all, and they become disenchanted with the effort and rant that "technical analysis doesn't work". They may even convince themselves -- depending on how badly they've been burned -- that anything having to do with "technical analysis" in any way whatsoever is just so much hokum and not worth the attention of the serious student of markets and investing.
But technical analysis is not indicators. Nor is it patterns. It is rather an analysis of the behavior of traders and investors that the indicators and patterns are supposed to reveal but rarely if ever do. And if one ever learns to trade emotionlessly, the truth of this becomes self-evident as one is able to assess and evaluate the emotional states and responses of those who remain easily manipulated by price movements. One accomplishes this by observing the efforts of other participants, the results they achieve, and their reactions to those results. At that point, one is in a much better position to profit from the confusion and gullibility of others. And while this may seem malicious, the lack of preparedness in others is not one's personal responsibility. Negotiating the currents and cross-currents is more than enough to occupy one's time and attention.
darktone
Veteren member
- Messages
- 4,019
- Likes
- 1,086
But technical analysis is not indicators. Nor is it patterns. It is rather an analysis of the behavior of traders and investors that the indicators and patterns are supposed to reveal but rarely if ever do. And if one ever learns to trade emotionlessly, the truth of this becomes self-evident as one is able to assess and evaluate the emotional states and responses of those who remain easily manipulated by price movements. One accomplishes this by observing the efforts of other participants, the results they achieve, and their reactions to those results. At that point, one is in a much better position to profit from the confusion and gullibility of others. And while this may seem malicious, the lack of preparedness in others is not one's personal responsibility. Negotiating the currents and cross-currents is more than enough to occupy one's time and attention.
I like this bit in particular 👍
Mr. Charts
Legendary member
- Messages
- 7,370
- Likes
- 1,200
Those who have read Trading Price and the Wycoff Method have a better understanding of what I look for in a chart and of the annotations I make than those who adopt a more standard view of charting. Given the number of people who are following this thread, therefore, it seems appropriate to review just what is meant by "technical analysis" not only as distinct from "fundamental analysis" but also as distinct from all the misinformation that circulates among the trading/investing community about just what technical analysis is and the information it is expected to provide.
A spreadsheet is a record of a company's financial behavior. It may be restated into a P&L or an income statement or whatever, but it usually begins as a spreadsheet. It tells you (or at least is supposed to tell you) where the money is coming from, where it's going, what management is doing with it, how it's being husbanded. A good detective, often an accountant, can tell you with impressive accuracy just what's going on in that company by tracking the flow of money hither and yon.
A chart is a record of a stock's price behavior or, more accurately, the behavior of those who are interested in buying or selling whatever it is that's being traded. It tells you who's interested in buying it, how many buyers there are, what price they're willing to pay (there have been many reasons advanced for the collapse of the Nasdaq in 2000, but the chief reason for the collapse was simply that the market ran out of people dumb enough to pay those prices; when the selling began, there were no buyers left on the field). It also tells you the same things about whatever sellers there may be in the house. But rather than do it with cells in a spreadsheet, it does it with a bar showing the opening price for the day and the low, high, and closing prices for the day. Combined with the number of shares/contracts/etc traded and a knowledge of the psychological and sociological significance of the relationships of these elements to each other, one can reach some pretty accurate conclusions about demand and supply. And since demand is what makes the price go up, this is worth knowing.
That, in its simplest form, is what a chart does, and the purpose of technical analysis is to assess and evaluate this behavior, the behavior of price, the behavior of traders, in order to determine to the best of one's ability the state of the balance between demand and supply. By conducting this assessment and evaluation, it is assumed that one can gain some sense of which camp is in charge, buyers or sellers. Some chartists go beyond this into "patterns", and as long as the link is maintained between what is perceived to be a pattern and the behavior that the pattern is supposed to illustrate (e.g., a "double top"), the pattern can provide a sort of shorthand or tag or hook that enables the trader to make a quicker decision. What happens more often, however, is that the link between the pattern and the behavior the pattern is supposed to illustrate is forgotten, and the pattern is followed doggishly, for no explicable reason, and patterns often degenerate into the silly.
Many chartists ignore behavior entirely and focus on "indicators", forgetting that it is the nature of traders' behavior that the indicators are supposed to indicate. They devote their time and efforts to finding just the right indicator and just the right settings, sometimes for years. But because they ignore the behavioral element, their analysis doesn't work well, or at all, and they become disenchanted with the effort and rant that "technical analysis doesn't work". They may even convince themselves -- depending on how badly they've been burned -- that anything having to do with "technical analysis" in any way whatsoever is just so much hokum and not worth the attention of the serious student of markets and investing.
But technical analysis is not indicators. Nor is it patterns. It is rather an analysis of the behavior of traders and investors that the indicators and patterns are supposed to reveal but rarely if ever do. And if one ever learns to trade emotionlessly, the truth of this becomes self-evident as one is able to assess and evaluate the emotional states and responses of those who remain easily manipulated by price movements. One accomplishes this by observing the efforts of other participants, the results they achieve, and their reactions to those results. At that point, one is in a much better position to profit from the confusion and gullibility of others. And while this may seem malicious, the lack of preparedness in others is not one's personal responsibility. Negotiating the currents and cross-currents is more than enough to occupy one's time and attention.
Posts like this are the reason it's worth looking at t2w
Similar threads
- Replies
- 0
- Views
- 2K