Kleft
Member
- Messages
- 56
- Likes
- 29
Where are we?
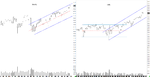
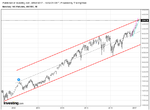
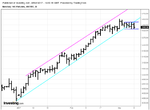
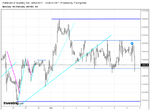
I'm trying to figure out what is most relevant in regards to the NQ moving forward, weekly and daily charts attached.
Price had largely moved sideways from July 2015 until August 2016 when it eventually pushed higher but this BO didn't get far and price ranged again. The daily shows the most recent range and the new uptrend from the breakout.
Ranges can be used as a reset to track new demand supply balances, but, I wonder if its a mistake to overlook everything that led up to July 2015.