wallstreet1928
Legendary member
- Messages
- 6,609
- Likes
- 89
Good Morning Folks
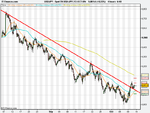
USD/JPY
I have already highlighted this trade to the followers of my blog yesterday.....
It has already given my 40 pips and i expect to get another 100-200 pips from this
classical example of resistance now = support
The Dollar is due for a rebound this week so I am being careful with any short Dollar positions
Hence the reason why the market is going to be weak today and oil/gold in particular will be weak- bias is on the short side