You are using an out of date browser. It may not display this or other websites correctly.
You should upgrade or use an alternative browser.
You should upgrade or use an alternative browser.
- Status
- Not open for further replies.
barjon
Legendary member
- Messages
- 10,752
- Likes
- 1,863
i must learn to read your point and figure charts Tim, thats for sure. will start from the beginning of your posts. it will take me sometime, but will learn 😀
j
jac
in the old days BC (before computers) point & figure was the easiest to do by hand and pretty informative - i miss them and it's nice to see tim reminding me of my youth 😈 i must crawl up into the loft and dig out some of the systems i used then.
good trading
jon
jac
in the old days BC (before computers) point & figure was the easiest to do by hand and pretty informative - i miss them and it's nice to see tim reminding me of my youth 😈 i must crawl up into the loft and dig out some of the systems i used then.
good trading
jon
hi jon,
im ignorant on the topic 😀 , so will start from scratch. im sure there is a lot around to read about them , so will keep myself busy.
mind the steps though 😉
good trading to you too 😀
j
Last edited:
timsk
Legendary member
- Messages
- 8,912
- Likes
- 3,629
Hi J',i must learn to read your point and figure charts Tim, thats for sure. will start from the beginning of your posts. it will take me sometime, but will learn 😀
j
If you're not familiar with P&F charts but are open minded to their potential, I would suggest that you don't read my posts! This is because I'm no expert and my use and interpretation of them is more likely to confuse than it is to enlighten. Once you understand their construction and are as happy looking at them as you are any other kind of chart, (this won't take long, I promise) then by all means trawl through my charts / posts if you really want to! 😉
A couple of sites to get you started:
http://stockcharts.com/school/doku.php?id=support:using_sharpcharts_po
http://208.149.108.62/cgi-bin/foxweb.exe/fwuniv?email=&doc=index.html
I didn't like P&F charts for a long time and only really decided to get to grips with them (to the small extent that I have) because Marc Rivalland is sooo enthusiastic about them and I've got quite a lot of time for him and his book:
http://www.harriman-house.com/pages/book.htm?BookCode=14705
After that, try the P&F bible:
http://www.harriman-house.com/pages/book.htm?BookCode=21822
Enjoy!
Tim.
timsk
Legendary member
- Messages
- 8,912
- Likes
- 3,629
Crisis Over . . . ?
NRK ended the week at £1.94, a 55% drop in share value in just 5 trading days. The crisis for the bank and its investors continues, but the market as a whole has responded very positively to Mr. darling's intervention. The bloo resistance line at 6400 on last week's chart was blown away by the huge gap up on Wednesday. This bullish move pushed the breakout column of bloo 'X's to 13 strong where, unsurprisingly, it ran out of steam. (I think I may have mentioned earlier in the thread that the last time the index exceeded this 'ceiling' of 13 bloo 'X's in a single column was over a protracted 2 month period between May and July 2005.) So a retracement was very much on the cards but, it was short and sweet, only retreating to the breakout level at 6400 which now becomes support. Historically, the likelihood of the index rising so that the current column of bloo 'X's exceeds the minimum of 3 - i.e. to form a column of 4 or more - is very high indeed. But, if it only manages to fill one more box, this will create a double top at 6500. If (second if) the index fails to move any higher and starts to fall, then the subsequent pressure on the 6400 support area will be huge. If it's breached, (third if 😉) P&Fers will be looking to go short at 6375. While the story can change very dramatically and equally quickly, as things stand, the chart remains very BULLISH.
Tim.
Attachments
barjon
Legendary member
- Messages
- 10,752
- Likes
- 1,863
yup, we're still in from around 6235 and three days above 6406 has confirmed the up swingtrend. We are near potential resistance around 6500 though.
Everyone should have taken 100+ points out of this so far and those just sitting quiet from entry without shifting their stoploss have an unrealised profit of 221 points on the close.
good trading
jon
Everyone should have taken 100+ points out of this so far and those just sitting quiet from entry without shifting their stoploss have an unrealised profit of 221 points on the close.
good trading
jon
Attachments
NRK ended the week at £1.94, a 55% drop in share value in just 5 trading days. The crisis for the bank and its investors continues, but the market as a whole has responded very positively to Mr. darling's intervention. The bloo resistance line at 6400 on last week's chart was blown away by the huge gap up on Wednesday. This bullish move pushed the breakout column of bloo 'X's to 13 strong where, unsurprisingly, it ran out of steam. (I think I may have mentioned earlier in the thread that the last time the index exceeded this 'ceiling' of 13 bloo 'X's in a single column was over a protracted 2 month period between May and July 2005.) So a retracement was very much on the cards but, it was short and sweet, only retreating to the breakout level at 6400 which now becomes support. Historically, the likelihood of the index rising so that the current column of bloo 'X's exceeds the minimum of 3 - i.e. to form a column of 4 or more - is very high indeed. But, if it only manages to fill one more box, this will create a double top at 6500. If (second if) the index fails to move any higher and starts to fall, then the subsequent pressure on the 6400 support area will be huge. If it's breached, (third if 😉) P&Fers will be looking to go short at 6375. While the story can change very dramatically and equally quickly, as things stand, the chart remains very BULLISH.
Tim.[/QU
Tim.
Just thought I would reply to your post .I used to use P n F charts some years ago but when I got my pc,I started to use Ma's and do like MA's.However I did find that the PnF method works.I have read several good books on the subject some time ago and you have now got me interested again.I have also done some work on fibonacci numbers etc,so I thought I would point out that,I notice on you 25 point chart,that columns of 3.5.8 and 13 occur regularly.Hope you don't mind me giving my observations about this.
timsk
Legendary member
- Messages
- 8,912
- Likes
- 3,629
😎I have read several good books on the subject some time ago and you have now got me interested again.
Of course not Fluke - more observations the better, thank you!I have also done some work on fibonacci numbers etc,so I thought I would point out that,I notice on you 25 point chart,that columns of 3.5.8 and 13 occur regularly.Hope you don't mind me giving my observations about this.
I've not applied Fib' levels to P&F charts, but I see no reason why they shouldn't work every bit as well (or not - depending on your views about Fib's) as they do on candle and bar charts. In theory, the levels ought to be 'cleaner' given that P&F filters out a lot of noise. I may have to take issue with your inclusion of 3 columns appearing regularly though. It depends entirely on whether the chart is bullish or bearish. When the chart is bullish, columns of only 3 bloo 'X's are really quite rare. Put it this way, typically, there is a 90%+ probability of the price moving up to create a column of 4 'X's or more. The reverse applies to a bearish chart and a column of red 'O's. However, as is to be expected, there is a much higher incidence of columns of just 3 red 'O's when the overall chart is bullish and 3 bloo 'X's when the overall chart is bearish. The stronger the trend, the more likely it is that the retracement column will be limited to just 3 boxes. Perhaps this is what you meant?
If we apply this to the latest chart in my previous post, the likelihood of the current column of 3 bloo 'X's moving up to fill a 4th box is 90%+ as the overall chart is BULLISH. Given the historical level of success, if a 4th bloo X fails to print, then in itself this is a very bearish signal indeed. I hope all this makes sense! 😉
Tim.
timsk
Legendary member
- Messages
- 8,912
- Likes
- 3,629
Sideways Chop
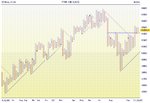
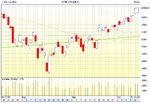
It's been a difficult week with lots of seemingly conflicting signals. I'll try to unravel the the P&F chart to see if it offers any hints as to how the current congestion area might be resolved. The beauty of P&F charts is that the patterns they contain are often very clear making them easy to spot. The first observation to make about this week's chart is the striking similarity between the current trading range and the one back in April. (Follow the horizontal dotted bloo line back to its start point.) Since then, he 6500 level has oscillated from resistance to support and back to resistance again. Last week's column of bloo 'X's did indeed fail to fill a 4th box to create the double top referred to above. However, look at a bar or candle chart and you'll see that it only failed to achieve this by a mere 6 points. So, this 'failure' isn't quite as bad as the current P&F chart makes it appear. That said, price did reverse to form a new column of red 'O's and, on Tuesday, support at 6400 was breached and a double bottom sell signal was generated. At that point, the P&F chart became BEARISH for the first time since mid August. However, the bearish status was very short lived and the sell signal turned out to be a false one. The chart reversed again to form the latest column of bloo 'X's. The breach of the high formed in the penultimate column of bloo 'X's (short horizontal dotted bloo line) reverses the chart back to BULLISH mode although, yet again, the index faltered at the 6500 ceiling. The current column of red 'O's would have to fall below support (red line at 6375) and fill the box below that at 6350 for the chart to become bearish. To conclude, while a breakout could of course go either way, on balance, the failure of the double bottom sell signal at 6375, the current BULLISH status of the chart and the continued pressure on resistance at 6500 favours the bulls. Just!
Tim.
But, if it only manages to fill one more box, this will create a double top at 6500. If (second if) the index fails to move any higher and starts to fall, then the subsequent pressure on the 6400 support area will be huge. If it's breached, (third if 😉) P&Fers will be looking to go short at 6375.
It's been a difficult week with lots of seemingly conflicting signals. I'll try to unravel the the P&F chart to see if it offers any hints as to how the current congestion area might be resolved. The beauty of P&F charts is that the patterns they contain are often very clear making them easy to spot. The first observation to make about this week's chart is the striking similarity between the current trading range and the one back in April. (Follow the horizontal dotted bloo line back to its start point.) Since then, he 6500 level has oscillated from resistance to support and back to resistance again. Last week's column of bloo 'X's did indeed fail to fill a 4th box to create the double top referred to above. However, look at a bar or candle chart and you'll see that it only failed to achieve this by a mere 6 points. So, this 'failure' isn't quite as bad as the current P&F chart makes it appear. That said, price did reverse to form a new column of red 'O's and, on Tuesday, support at 6400 was breached and a double bottom sell signal was generated. At that point, the P&F chart became BEARISH for the first time since mid August. However, the bearish status was very short lived and the sell signal turned out to be a false one. The chart reversed again to form the latest column of bloo 'X's. The breach of the high formed in the penultimate column of bloo 'X's (short horizontal dotted bloo line) reverses the chart back to BULLISH mode although, yet again, the index faltered at the 6500 ceiling. The current column of red 'O's would have to fall below support (red line at 6375) and fill the box below that at 6350 for the chart to become bearish. To conclude, while a breakout could of course go either way, on balance, the failure of the double bottom sell signal at 6375, the current BULLISH status of the chart and the continued pressure on resistance at 6500 favours the bulls. Just!
Tim.
Attachments
barjon
Legendary member
- Messages
- 10,752
- Likes
- 1,863
tim
yes, backwards and forwards in a 100 range for seven days now.
swingtrend still up and it depends on style whether people are still in sitting patiently or have chosen to depart and use their margin elsewhere.
nothing else to say until we see some move out of this.
good trading
jon
yes, backwards and forwards in a 100 range for seven days now.
swingtrend still up and it depends on style whether people are still in sitting patiently or have chosen to depart and use their margin elsewhere.
nothing else to say until we see some move out of this.
good trading
jon
timsk
Legendary member
- Messages
- 8,912
- Likes
- 3,629
Breakout Time
Tim.
(Note to self: prepare for major embarrassment and a slice of humble pie.)
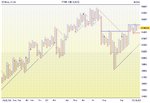
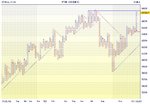
I think the FTSE heard you Jon and decided to get its **** into gear.:cheesy: The chart overall is now very BULLISH, with pretty much clear sky through to June and July's highs at 6750. With the Dow breaking to new highs this week, there could be a euphoric surge in the U.S. which will bode well for the FTSE. Of some immediate concern is the daily candlestick chart which shows the last three days printing higher lows and higher highs - but - on declining volume. So, the 6600 round number could be a sticking point. Additionally, given the significance of the 6500 level in recent months, the idea that this isn't tested at least once seems unlikely (dotted bloo line on chart). One thing is a virtual certainty. If the 7 year high at 6750 is to be breached, the current line of bloo 'X's won't be the column to do it. To reach that level, the current column would comprise 13 'X's and, in so doing, create a triple top. For the index to print a column of 14 or more, would be the equivalent of Jonny Wilkinson kicking a goal from inside his own 22. So, if the 6750 resistance is to be breached, there will, almost certainly, be a pullback column of red 'O's between now and then.nothing else to say until we see some move out of this.
Tim.
(Note to self: prepare for major embarrassment and a slice of humble pie.)
Attachments
Last edited:
black bear
Guest
- Messages
- 1,303
- Likes
- 165
Hi timsk and all on thread,
Moving back to Swings from monday, Great thread ,
I for one will keep me post shut, 😆 for once in my thread 😛
nice to see the P&F charts and good thoughts on read etc
Moving back to Swings from monday, Great thread ,
I for one will keep me post shut, 😆 for once in my thread 😛
nice to see the P&F charts and good thoughts on read etc
barjon
Legendary member
- Messages
- 10,752
- Likes
- 1,863
tim
yeah, still ticking along - I guess most still in will have their stop up in the 6450 - 6500 now for all or what's left of their positions. Others, who still have a full position may be starting to scale out but, whatever tactics are being employed, everyone will be booking profits except for those who went to break even too early.
develis - welcome to the thread!!
good trading
jon
barjon
Legendary member
- Messages
- 10,752
- Likes
- 1,863
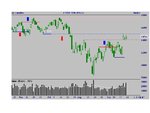
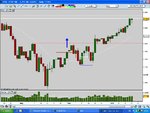
ok, time to start paying attention as the price reaches the resistance zone of the June highs. There's getting on for 500 points in this now and we don't want to watch it disappear. The zone is not well drawn and goes between 734 and 754 - some will have concluded it got near enough and exited yesterday or near the close today. Others will wait and see.
good trading
jon
ps: trying out ProRealTime charts for a change
good trading
jon
ps: trying out ProRealTime charts for a change
Attachments
timsk
Legendary member
- Messages
- 8,912
- Likes
- 3,629
ps: trying out ProRealTime charts for a change
Hmmm . . . looks a bit different to the ShareScope chart Jon. I confess to having had a glass of wine at the time of posting, so apologies in advance if I'm missing something or I'm being a complete **** 😉
Tim.
P.S. I'll update the P&F chart over the weekend.
Attachments
black bear
Guest
- Messages
- 1,303
- Likes
- 165
ok, time to start paying attention as the price reaches the resistance zone of the June highs. There's getting on for 500 points in this now and we don't want to watch it disappear. The zone is not well drawn and goes between 734 and 754 - some will have concluded it got near enough and exited yesterday or near the close today. Others will wait and see.
good trading
jon
ps: trying out ProRealTime charts for a change
Hi Barjon,
interested to no what you think regards charts
Just had me look at week charts, and agree with you any one who"s been in from last or change of trend should be taking some chips if not all off table.
IMO ready for classic 3 day pull back over a week with a couple of inside days or something along those lines. I will look to enter some place 😕 there.
4hr charts have pretty as picture trend line stretching back to 16th Aug, lower @ 6585 ish, 100ema nice smooth rise with it.
Narrow range day could be cue to exit or scale out.
The whole rally takes the shape of a V, I"m told shorting this formations is a mugs game so I for one will not. not done any research on this, just read it some ware so it could be pants 🙄
Yesterday the 11th Dow made horrible trend line breach 4 hr,chart and just regained it today. and sits clean on it. Day bar made higher high and lower low 😈 I don"t no what volumes were but if high not a good sign (wash out day) one of those preceded the BIG drop. Week candle printed Doji, and sits clean on last but one weeks high (support @ 13945) if this goes any longs in Ftse IMO should run for cover.
Ftse
Week rsi @ 82 set 5 , good strong move from 21 with small pause at the centre line. volumes have picked up a bit and split win/losers good 60/30 at least on most up days
Arrrhhh, just read the above back to myself and wonder what I been doing mucking about intra day 😱 Hindsight its so second sight is"nt it 😉
Last edited:
barjon
Legendary member
- Messages
- 10,752
- Likes
- 1,863
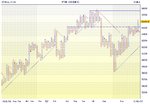
Hmmm . . . looks a bit different to the ShareScope chart Jon. I confess to having had a glass of wine at the time of posting, so apologies in advance if I'm missing something or I'm being a complete **** 😉
Tim.
P.S. I'll update the P&F chart over the weekend.
tim
yeah, the reason is prorealtime don't recognise gap openings (which is the "official" lse stance) but sharescope does
cheers
jon
timsk
Legendary member
- Messages
- 8,912
- Likes
- 3,629
Knock, Knock, Knocking on Heaven's Door
Tim
The story hasn't changed significantly from last week, so I'm going to stick with the comments quoted. However, I confess I am surprised that the current column of bloo 'X's has got as far as it has without retracing and that the 6500 level has got off scott free without being tested - so far!. Suffice to say, last week's 'note to self' is even more pertinent now than it was 7 days ago.If the 7 year high at 6750 is to be breached, the current line of bloo 'X's won't be the column to do it. To reach that level, the current column would comprise 13 'X's and, in so doing, create a triple top. For the index to print a column of 14 or more, would be the equivalent of Jonny Wilkinson kicking a goal from inside his own 22. So, if the 6750 resistance is to be breached, there will, almost certainly, be a pullback column of red 'O's between now and then.
Tim.
(Note to self: prepare for major embarrassment and a slice of humble pie.)
Tim
Attachments
- Status
- Not open for further replies.