You are using an out of date browser. It may not display this or other websites correctly.
You should upgrade or use an alternative browser.
You should upgrade or use an alternative browser.
Mr. G
Well-known member
- Messages
- 259
- Likes
- 3
mr g
i presume he still has the trend as UP, in which case - looking at FTSE - the 3/11 bar is the assumed swinglow (of the retracement) and a BUY signal was given yesterday when the high of that 3/11 bar went since it is assumed that the retracement is over and the up trend will continue.
good trading
jon
jon - yes he does. He has the signal at 5083 wheras I show the high for 3/11 at 5104. What you are saying makes sense, however. Marc's levels don't seem match though, especially on the DOW.
Thanks for the PM btw
Last edited:
barjon
Legendary member
- Messages
- 10,752
- Likes
- 1,863
jon - yes he does. He has the signal at 5083 wheras I show the high for 3/11 at 5104. What you are saying makes sense, however. Marc's levels don't seem match though, especially on the DOW.
Thanks for the PM btw
mrG
I don't think your data provider recognises gap openings (which is the "official" position). FTSE opened @ 5082 on 3/11 which was also the high.
good trading
jon
barjon
Legendary member
- Messages
- 10,752
- Likes
- 1,863
tom
The "official" line from LSE is that today's open = yesterday's close, which is obviously divorced from reality. I suppose the argument is that it is just an index and not directly tradeable as such, so it doesn't really matter. I suspect that if you opened SB/CFD accounts to trade proxy FTSE with 50 different companies you'd get almost as many variations in the opening price offered 😏.
The directly traded futures offer reality, of course, I expect that's why you can't get a free feed!!
When I'm SBing FTSE I've given up trying to match their price against actual FTSE and just trade off the SB charts.
It all goes to show why TA can't be regarded as an exact science - just gives you a reason to enter and it's your management of it from there that counts,
good trading
jon
Mr. G
Well-known member
- Messages
- 259
- Likes
- 3
mrG
I don't think your data provider recognises gap openings (which is the "official" position). FTSE opened @ 5082 on 3/11 which was also the high.
good trading
jon
Thanks jon. You're right - I'm not seeing gaps. Where do you get the 'real' numbers from?
tenbobtrader
Guest
- Messages
- 450
- Likes
- 140
andy,
the trend's still up 'til 4995 goes and there's been a buy signal (see above) p'raps global warming is to blame.
good trading
jon
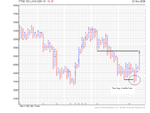
Hi Jon
just thought ftse at an interesting level - 4995 day swing trend change is pretty close to last months low - a narrow range with slight volume increase at about 50 % mark - MOM ?
think it just became a little bit more interesting after this weeks PA - one way trade from the lows - all news was Interpreted very good 🙂
a level to remember perhaps - or not - time will tell as usual .......
have a good weekend - good to see the thread up and running again Jon
later
Andy
Attachments
tenbobtrader
Guest
- Messages
- 450
- Likes
- 140
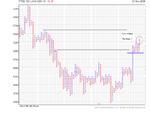
MOM still in play
guess everyones away spending their hard earned or turned into position traders
charts ~
thoughts anyone ? ............
yes Jon I know .......... the trend is still up 🙂
guess everyones away spending their hard earned or turned into position traders
charts ~
thoughts anyone ? ............
yes Jon I know .......... the trend is still up 🙂
Attachments
Last edited:
tenbobtrader
Guest
- Messages
- 450
- Likes
- 140
Nearly the end of the month and I have reviewed my November trade log (Month 1). Should have persevered with these things years ago after several false starts.
Spent November trading FTSE350 members, no index trades, and it was a month of two distinct halves. Summarising greatly -
75% of my Longs opened in Weeks 1 and 2 were closed for a profit. None of my Longs opened in Weeks 3 and 4 closed at a profit, and though I have a couple still open, both currently in the red. I didnt find as many Short oppportunities, 25% of those closed ended at a profit, though I am still running the last third: these are either marginally in the red or well into profit. The Shorts have generally been only half the size of the Longs.
Its obvious now that I look back that if I had been an equity buyer when I would have been swing trading long on the FTSE100, using the rules as applied in this thread, and with RSI as confirmation, I would have had a sizzling month. Why didn't I see this before?
Mr. G
Well-known member
- Messages
- 259
- Likes
- 3
Its obvious now that I look back that if I had been an equity buyer when I would have been swing trading long on the FTSE100, using the rules as applied in this thread, and with RSI as confirmation, I would have had a sizzling month. Why didn't I see this before?
Tom - Would that be the 3-bar rule or the 2-bar rule?
On the RSI - how do you use it for confirmation - up sloping for a buy, down sloping for a sell?
How do you screen for the rules or do you just flick through each chart?
Last edited:
Tom - Would that be the 3-bar rule or the 2-bar rule?
On the RSI - how do you use it for confirmation - up sloping for a buy, down sloping for a sell?
How do you screen for the rules or do you just flick through each chart?
This is using the 3-bar rule. Looking back further over the weekend, it seems healthy to be buying FTSE350 stocks when the FTSE100 has made a swing low and the 8RSI (Simple) is below 50.
To identify the best stocks to buy I manually screen the full set for strongest trends -
1. up more than FTSE100 over last 6 months
2. best Trend Strength Indicator (this is my own simple measure - percentage count of how much weekly Close, High or Low incursion across the 50EMA a stock made over the last 33wks. More on this later when I have time.
3. on a FTSE100 'Buy' day (following swing low, with low 8RSI) buy best TSI stocks which are also in swing uptrends as per this thread's conventional system, whioch are below their last swing high (but they don't have to be making a 3-bar swing low themselves).
More later. Off to office now.
barjon
Legendary member
- Messages
- 10,752
- Likes
- 1,863
hi guys
just back from a couple of weeks in the sun and didn't look at the market once!!
my main stuff is with ftse100 shares using the same 3 bar route. don't take much notice of rsi though.
have a stable of about 15 favourites and change the mix from time to time. with these sometimes follow tom's thoughts of not necessarily waiting for 3 bars if ftse looks good. apart from that just eyeball other 85 or so daily and look at those forming 3 bar swing lows/highs.
good trading
jon
hi guys
just back from a couple of weeks in the sun and didn't look at the market once!!
my main stuff is with ftse100 shares using the same 3 bar route. don't take much notice of rsi though.
have a stable of about 15 favourites and change the mix from time to time. with these sometimes follow tom's thoughts of not necessarily waiting for 3 bars if ftse looks good. apart from that just eyeball other 85 or so daily and look at those forming 3 bar swing lows/highs.
good trading
jon
Sounds good to me. There's no point us trying to convince ourselves this TA is scientific to the ultimate degree. if the FTSE's going up, most of members wil be going up too.
barjon
Legendary member
- Messages
- 10,752
- Likes
- 1,863
................There's no point us trying to convince ourselves this TA is scientific to the ultimate degree.............
Never a truer word, Tom. Whatever TA anyone uses all it does really is to give you a reason to enter - it's what you do from there that counts.
good trading
jon
33 week Trend Strength Indicator. Allows a normalised score to be allocated to a price chart to alow comparison of trend strength.
Plot price chart over last 33 weeks as weekly HLC bars. For each weekly H, L or C that lies below the 50EMA subtract 1 point. Say a share / index had three weeks of lat 33 with all 3 H, L and C below 50EMA, all other H,L and C's completely above. This would give TSI of 100-9 = 93%.
I wouldn't say that this trend had a 93% probability of continuing, but it certainly scores better than a chart that bumps along the 50 week after week. Have a look at Old Mutual as an example - I think I recall Friday's round-up gave it 100%.
Similar threads
- Replies
- 26
- Views
- 10K