You are using an out of date browser. It may not display this or other websites correctly.
You should upgrade or use an alternative browser.
You should upgrade or use an alternative browser.
tenbobtrader
Guest
- Messages
- 450
- Likes
- 140
mix and match
p&f 50 pt prints first 3 box reversal for some time and joins USA charts
2 box retrace from here would be nice if your looking to the short side
bar chart would look something like this ~
here is one I made earlier 🙂
p&f 50 pt prints first 3 box reversal for some time and joins USA charts
2 box retrace from here would be nice if your looking to the short side
bar chart would look something like this ~
here is one I made earlier 🙂
Attachments
spreadrisk
Junior member
- Messages
- 37
- Likes
- 1
From Marc Rivallands web site, updated today...
"Trend: Up (since breach of 4354 on 16.07.09). Not clear. For the very first time, the FTSE 100 has made a swing low (28th Sep) a new swing high and breached the swing low, all within 3 days. I shall assume the trend has not changed to down until the US markets signal a change in trend."
"Trend: Up (since breach of 4354 on 16.07.09). Not clear. For the very first time, the FTSE 100 has made a swing low (28th Sep) a new swing high and breached the swing low, all within 3 days. I shall assume the trend has not changed to down until the US markets signal a change in trend."
barjon
Legendary member
- Messages
- 10,752
- Likes
- 1,863
sorry chaps.
what exactly is a swing low?
and what is a swing high?
the price hitting the top and bottom of envelope/channel?
jonboy
the thread is a follow on from this wot i rote T2W Day Trading & Forex Community which should explain it for you. There are other definitions though.
cheers
jon(grandad)
tenbobtrader
Guest
- Messages
- 450
- Likes
- 140
From Marc Rivallands web site, updated today...
"Trend: Up (since breach of 4354 on 16.07.09). Not clear. For the very first time, the FTSE 100 has made a swing low (28th Sep) a new swing high and breached the swing low, all within 3 days. I shall assume the trend has not changed to down until the US markets signal a change in trend."
Hi SR
seem to remember Marc referred to swing low forming and being taken out in quick order in his book
he considered event significant when he wrote it
volume into the end of the last contract was interesting
we will see, all will be revealed soon enough
Andy
The FTSE printed an inside day with very narrow range so I guess the big boys were as tentative as we were on this market. I got in short, late, but stopped out and flat now. S&P had no doubts and ended strong and I don't doubt we will see FTSE Friday confirmed as a swing low first thing tomorrow: this pattern already shows on the SB charts. I <think> that this bull market is bonkers, but I <see> that we are still in an uptrend, so I have in place my buy order above today's best.
tenbobtrader
Guest
- Messages
- 450
- Likes
- 140
you have the big 2 on your side
Hi tomorton
you have the big 2 on your side with perhaps a bit more head room
mind the low doors 🙂
good luck :clover:
later
Andy
The FTSE printed an inside day with very narrow range so I guess the big boys were as tentative as we were on this market. I got in short, late, but stopped out and flat now. S&P had no doubts and ended strong and I don't doubt we will see FTSE Friday confirmed as a swing low first thing tomorrow: this pattern already shows on the SB charts. I <think> that this bull market is bonkers, but I <see> that we are still in an uptrend, so I have in place my buy order above today's best.
Hi tomorton
you have the big 2 on your side with perhaps a bit more head room
mind the low doors 🙂
good luck :clover:
later
Andy
Attachments
Mr. G
Well-known member
- Messages
- 259
- Likes
- 3
p&f 50 pt prints first 3 box reversal for some time and joins USA charts
2 box retrace from here would be nice if your looking to the short side
bar chart would look something like this ~
here is one I made earlier 🙂
could be on for that 2 box retrace......
tenbobtrader
Guest
- Messages
- 450
- Likes
- 140
could be on for that 2 box retrace......
🙂
>>>>>>>>>>>
into a narrow range day perhaps on wednesday ahead of BOE on thursday
final spike into announcement at wednesdays high or low
chop chop shake fake spike chop chop into and through USA open 😡😛😡:clap:😡
EOD result = 🙁
makes move into the last 1.5 hr of the session
will it won't it will it won't it into Friday
not worth chancing it into the weekend is it
:-0 .......... I new it !
😆😆😆😆😆😆
do it all again next week
have fun and a good week end
later
Andy
Last edited:
tenbobtrader
Guest
- Messages
- 450
- Likes
- 140
If your take on ftse is the swing trend is down
interesting charts across the methods
require Tomorton to validate candle patterns .... just a guesser myself 🙂
think the week is pretty bullish engulfer type pattern
think the day is pretty bearish type pattern
outlined the week IB candle breach to add to the mix 🙂
at potential R
errrrrrrrrrrrrrrrr 😕
I was right ........ not worth doing anything into the weekend :smart:
have a good weekend
Andy
Attachments
barjon
Legendary member
- Messages
- 10,752
- Likes
- 1,863
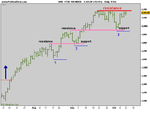
A few bits and pieces on FTSE.
Whatever the rules I think we have to regard points 1, 2 and 3 as swing lows for future reference. Interesting that 2 and 3 are about 50% retracements of the immediately prior up-leg and that earlier resistance became support at these levels.
fwiw I still have trend as up (with enough warning lights lit to have triggered exiting longs - not re-entered so that's cost a bit 🙁) and I'll stay that way until I see 3 go.
Others who see the trend as having changed to down have legitimate claims but, whichever side you're on, we're back up near heavy resistance and both are on tenterhooks to see what happens next.
Will the blue army storm the 5200 fortress and raise their standard, or will the boiling oil poured on them by the red defenders send them scampering back to the lowlands. Take your seats, ladies and gentlemen, lay in the beer and popcorn.
good trading
jon
Attachments
tenbobtrader
Guest
- Messages
- 450
- Likes
- 140
"Will the blue army storm the 5200 fortress and raise their standard, or will the boiling oil poured on them by the red defenders send them scampering back to the lowlands. Take your seats, ladies and gentlemen, lay in the beer and popcorn"
wot da ya think about the volume ?
dunno ....... give us a chip
shut up .... and watch the show
wot da ya think about the volume ?
dunno ....... give us a chip
shut up .... and watch the show
Attachments

Took a look at the biggest 20 FTSE100 shares this morning to see if they indicate a turn approaching.
Based on a simple 14EMA crossover pattern, I have 12 showing Long signals, 8 Short. Using a simple scoring system for the two day pattern forming the crossover, to score its strength, the Shorts scored 73% overall, the Long 64%. 5 of the 8 Short signals have flashed this week.
For the same 20 companies, Director transactions (anyone still look at these?) in the last month -
sales outweighed purchases by over 300 to 1 (£24,442,600 to £73,090).
I suppose technically we are still in an uptrend, but it looks like there is lessening conviction behind it. As it seems not a good time to be a buyer, I closed my FTSE100 long and opened a clutch of FTSE350 shorts yesterday.
tenbobtrader
Guest
- Messages
- 450
- Likes
- 140
good post and thoughts tomorton
who do you use for individual analysis ?
Big Charts - Big trend
volume ------ low
expected div on rsi etc creeping in
volume held up on narrow spreads - thur fri - day !
bit over my head but ~
guess the value of pound must be added to the mix to, makes it cheap as chips to buy british 🙂
anyway suns up - off to the beach
have a good one
Andy
Attachments
Last edited:
Hi Andy - For individual equities (like most people, this FTSE swing trading is not where I put most of my trading cash) I use Sharescope EOD charts and just look for established trends with a rather ad hoc bunnch of chart set-ups - weekly bar with 50EMA, candlesticks with 10 and 40EMA crossover, 2-day candlestick patterns with 14EMA. Best if they all say the same thing. But if I am being truly honest, I am happy to open 5 or 6 small equity positions simultaneously, then quickly eliminate the ones that don't immediately continue as the TA made me think and enlarge the remainder that do: usually possible within 2-3 days.
The only hint of fundamentals I use for entry timing is results - enter at the close in the direction of the day's move on results released that morning. Can highlight major trend chart reversals, but ready to take modest profit if that's all there is. And if it aligns with TA as above, so much the better. Director buys prior to long entry would suggest a larger position would be worth the risk but not useful for timing (and I ignore sales).
The only hint of fundamentals I use for entry timing is results - enter at the close in the direction of the day's move on results released that morning. Can highlight major trend chart reversals, but ready to take modest profit if that's all there is. And if it aligns with TA as above, so much the better. Director buys prior to long entry would suggest a larger position would be worth the risk but not useful for timing (and I ignore sales).
Amazing - another new high: but noticed its built on a gap (exhaustion?) from Friday's high? Negative divergence on RSI. Oddly enough, though the index closed higher than Friday, by 0.9%, my basket of FTSE350 shorts has gone from slightly negative to slightly in the money, 5 of the 7 dropping today. And now the Dow is 70pts off its earlier best.
Feels to me like the weather's turning cold.
Feels to me like the weather's turning cold.
tenbobtrader
Guest
- Messages
- 450
- Likes
- 140
Amazing - another new high: but noticed its built on a gap (exhaustion?) from Friday's high? Negative divergence on RSI. Oddly enough, though the index closed higher than Friday, by 0.9%, my basket of FTSE350 shorts has gone from slightly negative to slightly in the money, 5 of the 7 dropping today. And now the Dow is 70pts off its earlier best.
Feels to me like the weather's turning cold.
time of year tomorton
the big chart ............ :arrowu::arrowd:
does that count as a narrow range bar Jon 🙂
later
Andy
Attachments
Mr. G
Well-known member
- Messages
- 259
- Likes
- 3
Folks - Marc Rivalland updated his website last night saying that FTSE and the DOW both gave continuation signals yesterday. Can anyone explain this as I'm scratching my head here trying to understand how he has come up with the levels. I have also e-mailed him to ask.....
barjon
Legendary member
- Messages
- 10,752
- Likes
- 1,863
mr g
i presume he still has the trend as UP, in which case - looking at FTSE - the 3/11 bar is the assumed swinglow (of the retracement) and a BUY signal was given yesterday when the high of that 3/11 bar went since it is assumed that the retracement is over and the up trend will continue.
good trading
jon
Similar threads
- Replies
- 26
- Views
- 10K