swingin' the ftse

Status
Not open for further replies.
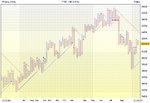
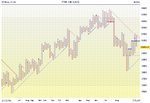
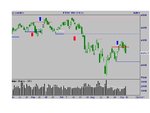
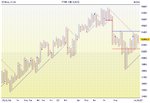
mmm, well from extremes, 6754 to 5821, the recent down move was 933 points of which around 333 were accounted for by opening gaps. Admittedly, a couple of gaps closed after a day or so and if you were particularly adroit you might have got around 170 of that 333 back, but you would need to have been adroit.

The main cause of opening gaps in ftse is post London close movement in Wall Street. If you avoid big US news days (post London close) and long weekends where there's a double wall street dose to contend with then the risk is less than it seems - particularly when short since there are few overnight (or over weekend) world events that trigger massive rises (white swan events?? :cheesy: ).

good trading

jon
 
. . .That does not mean that the swing signal cannot be used to advantage by intraday traders, though.
Very true Split' and, guess what, there's a chart that throws up these very opportunities. You've guessed it - the point & figure chart!

Where bar and candle charts can confuse, the P&F chart provides clarity. In his last but one post post, Jon suggested that aggressive swing traders will already be short and the remainder are waiting to jump in following the breach of 6194. And he's spot on, as ever. Whilst this scenario could easily unfold, the P&F chart hints at a possible alternative. Since the breach of the double top at 6150 (horizontal bloo line on chart) the P&F chart is officially bullish. This is in spite of the current column of 3 red circles. In the event that the index doesn't fall to 6175, thereby causing a 4th red circle to print, but instead rises to 6275, then a new line of bloo 'X's will form. This would be very bullish indeed. A mere 3 red 'O's in a strong down trend (if that's what we're in) is most unusual. So, if price rises to 6275, thereby creating a double top buy signal, the probability of the index rising another 25 points to sniff around 6300 is in the region of 90%. For day traders, this represents a high probability and low risk opportunity to take 25pts off the table. Additional confirmation of bullish activity can be seen of the weekly candle chart. The key 6000 level looks safe for the time being and a rise to 6275 would take the index back above the long term trend line. Interesting times.
Tim.
 

Attachments

  • FTSE_P&F_24_08_07.jpg
    FTSE_P&F_24_08_07.jpg
    216.4 KB · Views: 173
  • FTSE_Weekly_Candle_24_08_07.jpg
    FTSE_Weekly_Candle_24_08_07.jpg
    140.8 KB · Views: 167
I don't use them now that it is so much easier to get real time charts on the net. I used to use them before, because it was the only , really, quick way to keep track of a dozen charts at once.

The obstacle that I find with them is the number of points per square--you are using 20 points and it takes sixty to reverse. Even then you don't count the ones that go over the square, unless that square gets filled.

I have tried the Sharescope ones and Footsie, at 6000 points, is now too volatile for small amounts per square, which is why you use 20, I suppose.

Anyway, I'm always happy to be convinced that I am wrong and would appreciate your feedback on this. At present, I am an intraday trader, until I lose again---then I'll go back to shares, probably, but twenty points profit on a trade means a lot to me.
 
The obstacle that I find with them is the number of points per square--you are using 20 points and it takes sixty to reverse. Even then you don't count the ones that go over the square, unless that square gets filled.

Hi Split',
The issue of box size is one that troubles lots of traders, causing many to shy away from using P&F charts. This is a shame as, far from being a handicap in the charting technique, it's actually a strength. Three box reversal P&F charts are a superb asymmetric filter that performs two key roles: they eradicate 'noise' and illustrate where the current momentum lies. In reality, the box size (25 in my chart by the way - not 20) is really no different from deciding whether to look at a 5 minute, 10 minute, hourly or daily candle/bar chart. The choice is governed by the price and volatility of the instrument to be traded and the type of trade to be undertaken; intraday, swing or position. I use a 25 box size for the FTSE on this thread to maintain consistency between posts and, additionally, because on average it produces at least one new column of bloo 'X's or red 'O's each week, which ties in nicely with Jon's daily candle charts and the time horizon of the average swing trader. Traders who use P&F charts exclusively may reduce the box size to 10 or less to fine-tune their entry and exit and refer to 50 or even a 100 box chart to get a macro view of trend and long term support and resistance.
Tim.
 
mmm, so wot happened while I was busy a'boozin and a'golfin in France.

Well, it tried and it looks like those who adopt the "1:1 first target and stop on the remainder to b/e" tactics will have made a few bob, those who moved stop to b/e will have come out flat and those who just stuck with it are nursing losses with stoploss triggered.

Bit early to call Friday's action as a swing high breach and change of trend so await tomorrow with interest.

Good trading

jon

ps: interesting P&F thoughts, Tim.
 

Attachments

  • ftseswing.JPG
    ftseswing.JPG
    73.9 KB · Views: 164
mmm, so wot happened while I was busy a'boozin and a'golfin in France.

Well, it tried and it looks like those who adopt the "1:1 first target and stop on the remainder to b/e" tactics will have made a few bob, those who moved stop to b/e will have come out flat and those who just stuck with it are nursing losses with stoploss triggered.

Bit early to call Friday's action as a swing high breach and change of trend so await tomorrow with interest.

Good trading

jon

ps: interesting P&F thoughts, Tim.


hi jon,

interesting chart....seems like an obvious measured move for an all out type of exit.....

played with your chart and made it 4hr, there was a double target for exit (basically 5890 on both cases)

mmm, nice to see textbook stuff actually works on other markets :p


j
 

Attachments

  • ftse.gif
    ftse.gif
    16 KB · Views: 181
hi jon,

interesting chart....seems like an obvious measured move for an all out type of exit.....

played with your chart and made it 4hr, there was a double target for exit (basically 5890 on both cases)

mmm, nice to see textbook stuff actually works on other markets :p


j

Did I understand Oscar correctly when he said that US had a holiday tomorrow? That might influence Footsie.

Jon, for some reason your trip to France reminded me of the of the exchange between the two South Rhodesian prime ministers, before independence. They were from different social backgrounds, the the former had been an engine-driver. He said " I was shuntin' and hootin' when you were huntin' and shootin'!

Nothing to do with anything, of course, just that your "boozin' and golfin' " struck a cord.:)

Split
 
Bit early to call Friday's action as a swing high breach and change of trend so await tomorrow with interest.

Indeed Jon. (Hope the weather treated you well in french France btw.)
The trend on the P&F chart is still down in as much as there is a sequence of lower lows and lower highs. I've not marked them but, hopefully, they are clear for everyone to see. However, in line with last week's P&F chart, this chart remains BULLISH! In fact, it's more bullish than last week's chart which comes as no surprise given that the index closed not only above last weeks close, but above last week's high as well. More importantly, the P&F chart tells us that the bears failed to test the swing low of 6050 (red dotted line on my P&F chart - the 10/08/07 candle on Jon's chart) - let alone breach it and - potentially - to threaten the major low at 5825. Added to this, there is a second breach of a double top buy signal (second bloo horizontal line). Clearly, the index is moving towards the red bearish resistance line and is quite some way away from the bloo bullish support line. Aggressive P&F enthusiasts will be long from the second breach of the first double top (1st bloo horizontal line) at 6175. The current column of 9 bloo 'X's was formed over a mere 3 days and is unlikely to continue much higher before running out of steam and reversing to form a new column of red 'O's. (The largest column of bloo 'X's on the chart comprises 13 'X's dating back to May 2006.) So, IF the ensuing column of red 'O's isn't anything too offensive (i.e. testing the low of the previous column of red 'O's just above the red dotted line at 6075), then a low risk long entry would be at the following 3 box bullish 25 point reversal - wherever it might fall.

Well done to anyone who manages to follow my P&F posts - I wish I could make them clearer and simpler to follow!
Tim.
 

Attachments

  • FTSE_P&F_31_08_07.jpg
    FTSE_P&F_31_08_07.jpg
    215.6 KB · Views: 158
Prepare to go Long!

As expected, the column of bloo 'X's on last week's chart only increased another 3 squares (75 points) before reversing. The current column of red 'O's is strong but, nonetheless, would have to fall all the way down to 6075 to create a double bottom with the previous column of red 'O's. Whilst this is entirely possible - obviously - it's not very probable. As things currently stand, both the two most recent columns of bloo 'X's and red 'O's exhibit higher highs and higher lows. Therefore, the P&F chart remains BULLISH, even though the last 3 days look pretty grim when viewing a candle or bar chart. P&F enthusiasts will be open to the possivbility of going long - if the right opportunity presents itself. Potentially, that opportunity could unfold quite soon. On the home front, interest rates have not been increased and, next week, commentators expect Ben Bernanke to lower interest rates in the U.S. If he does, this would be good news for equities and the current column of red 'O's could halt and reverse to form a new column of bloo 'X's. This would present an excellent opportunity to go long.

So folks, if the news unfolds as expected and the market responds as expected - prepare to go long! (Remember, you heard it here first!)
Tim.
 

Attachments

  • FTSE_P&F_07_09_07.jpg
    FTSE_P&F_07_09_07.jpg
    216 KB · Views: 142
interesting, tim

The upward breach of the last downtrend swing high lasted three days and , technically, changed the swing trend back to up. Confirmation of that would come with an upward move above 6400. Friday's action gave us a potential swing low (dotted blue line) with a potential entry above 6343 (thin white line). If that triggered it would give an extremely uncomfortable stoploss some 165 points away so it would only be for the really bold.

Always looking both ways :) a continued fall below 6056 (blue line) would re-assert the swing downtrend. A bit more down next week giving a new potential swing low with a much narrower range would be nice.

good trading

jon
 

Attachments

  • ftseswing.JPG
    ftseswing.JPG
    67 KB · Views: 168
New potential swing low today with a potential long signal above 6232. Mmmm.

good trading

jon
 
hope you traded it :cool:
Indeed!
The P&F reversal came at 6200 - very close to your entry Jon, which may give you some extra confidence! ;)
However, I'm a tad suspicious as B.B. at the Fed' Reserve didn't lower U.S. interest rates as expected, so we'll have to see what the markets think about this over the coming days. Also, the 50 day moving average is snogging the tonsils off the 200 day M.A. - their first embrace since July last year. The index really needs to push through 6375 - 6400 to repair the damage done in late July to early August and to restore confidence, IMO.
Tim.
 
first target met @ 6349 (+114)
stop on remainder to b/e (6235)
 
first target met @ 6349 (+114)
stop on remainder to b/e (6235)
Nice one Jon, well done. Are you going to raise your stop to protect profits? The reason I ask is for three reasons:
1. We (the royal 'we' that is, i.e. the index!) is clearly heading into an area of resistance at 6375 - 6400.
2. The current column of bloo 'X's on the P&F chart is 9 strong, only 4 short of the maximum of 13 achieved in the last 18 months or so.
3. Over the last three days we've seen three consecutive bull candles on increasing volume, which is pretty unusual and some sort of reaction - short term or otherwise - is to be expected.
Take the money and run, or stick to the game plan????
;)
Tim.
 
tim

yeah, 6400 +- is a key area and I'll watch what happens - might have stop up around 6275 by the end of Friday, or maybe even closer, or may even have closed. Half is already off the table at first target so really wait and see what the market tells me for the rest (assuming the facts don't get lost in translation 'cos I only speak pidgin-market, of course :confused: )

good trading

jon
 
Jon,

Months ago, (last year?) I remember us discussing NRK. I hope that that you, still, have it as a short---I wish I had! Makes me hanker after longer term trading, but I still managed to short Footsie early, this morning.

Split
 
Sentiment Rulz!

Technically, the P&F chart is still BULLISH. Friday's price action was interesting in as much that although it closed down significantly on Thursday's close, the spike suggests that there was a fair amount of buying going on. Some traders may take the view that the fall is purely sentiment driven because of all the shenanigans in the banking sector - NRK in particular. This will probably spill over into next week (and beyond?) and, therefore, the new column of red 'O's could easily extend further downwards. If it does, the solid red horizontal line at 6125 represents the next potential double bottom, a breach of which would make the P&F chart bearish. But, that's quite a long way off and the late buying on Friday means that as things stand, the price only needs to rise another 11 points for the red column of 'O's to reverse to form a new column of bloo 'X's. However, this will not happen if the index falls to 6200 - the dotted line on the chart. To recap: an 89 point drop would retain the current column of red 'O's, alternatively, a mere 11 point increase would see the creation of a new column of bloo 'X's. If the latter scenario unfolds, the bulls would be gaining momentum with the 6400 resistance target very much within their sights. Which of the two outcomes is most probable is a tough call and is likely to be governed by the the BoE and the directors of NRK in their bid to calm fears and restore confidence.
Tim.
 

Attachments

  • FTSE_P&F_14_09_07.jpg
    FTSE_P&F_14_09_07.jpg
    216.9 KB · Views: 220
Jon,

Months ago, (last year?) I remember us discussing NRK. I hope that that you, still, have it as a short---I wish I had! Makes me hanker after longer term trading, but I still managed to short Footsie early, this morning.

Split

split

ah, those days before you succumbed to the siren song of the ftse :devilish: - had three or four profitable bites on the way down but not the precipice fall.

sounds like a nice short for you on ftse - solved the stoploss dilemma since b/e on the remainder went - hope you were out somewhere round there or better.

good trading

jon
 
Status
Not open for further replies.
Top