swingin' the ftse

Status
Not open for further replies.
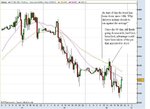
Dramatically Bearish

For the time being at least, the P&F chart remains BULLISH and would only switch to bearish if the short red horizontal line at the foot of the previous column of 3 red 'O's is breached. Should this happen, the index will find a wealth of support in the 6375 - 6425 zone. If it busts through that lot, it'll be time to sell everything, short everything and send cards of sympathy to LTBH investors.
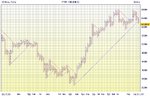
Well, so much for last week's hypothesis about a triangle developing! As for the 6375 - 6425 support zone, such was the level of supply in the market that the index barely even acknowledged its existence. Last Monday's fall (6th Nov') created a triple bottom at 6425. The pullback on Tuesday - if one can describe it as such - was very weak, but enough to create the minimum reversal count of 3 bloo 'X's. The subsequent reversal on Wednesday resulted in a breach of the newly created triple bottom and a breach of the diagonal bloo bullish support line. Suffice to say, the P&F chart is now decidedly BEARISH with no immediate areas of support likely to halt the decline. It might ease up at around 6200 (the dotted red horizontal line) and, beneath that, the all important magic round number of 6000 (solid red horizontal line). As the chart stands, I'm struggling to find anything bullish to say about it at all. Time to start writing those sympathy cards?
Tim.
 

Attachments

  • FTSE_P&F_09_11_07.jpg
    FTSE_P&F_09_11_07.jpg
    228.2 KB · Views: 178
Hi Timsk,

At last I have managed to catch your down swing to 6304, where it might rebound. I've missed them before.You would need it to go to 6400 to get the three up boxes, right? Or would you ignore those four points and say 6375?

My Sharescope 1% 3 box reversal doesn't look too bad, yet, this morning.

Split
 
You would need it to go to 6400 to get the three up boxes, right? Or would you ignore those four points and say 6375?
Hi Split,
All the P&F charts I've posted are based on the E.o.D. high / low. So, for a reversal of 3 bloo 'X's or more to print, two things need to happen. Firstly, the daily low must not fall to 6250 or below. If it does, even if the daily high went up to say 7000, the chart would still print a new red 'O' at the bottom of the current column of 'O's. Secondly, the high must exceed 6350. If these two criteria are met, tomorrow's chart will print a new column of 3 bloo 'X's indicating a reversal up has taken place. If price exceeds 6375, then 4 bloo 'X's will print. 6400 will produce 5 bloo 'X's etc. etc. In terms of trading, the trend is emphatically down, supply far outstrips demand, so initiating a long position would be counter trend and highly risky IMO. There will be a reversal sooner or later and, assuming that it's not too strong and doesn't reverse the chart back into bullish mode, I would look to go short on the subsequent reversal down. All of which is a long winded way of saying that I'd trade the pull back when it comes!I hope that's clear and answers your questions? :)
Tim.
 
Free INFO

Hi Timsk,

At last I have managed to catch your down swing to 6304, where it might rebound. I've missed them before.You would need it to go to 6400 to get the three up boxes, right? Or would you ignore those four points and say 6375?

My Sharescope 1% 3 box reversal doesn't look too bad, yet, this morning.

Split

Hi Split

Free info on p&f at link below, think the guy does it all on sharescope anyway (middle package)

http://www.marcrivalland.com/default.asp

Andy AKA
 
Monday 12th November 2007

All the P&F charts I've posted are based on the E.o.D. high / low. So, for a reversal of 3 bloo 'X's or more to print, two things need to happen. Firstly, the daily low must not fall to 6250 or below. Secondly, the high must exceed 6350. If these two criteria are met, tomorrow's chart will print a new column of 3 bloo 'X's indicating a reversal up has taken place.
As it happened, the index obliged and did exactly as I outlined in my earlier post, so I thought I'd post a follow up chart to illustrate it. If you look at the OHLC data in the chart legend, you'll see the index made a L.o.D. at 6287. This is a comfortable 37 points above the 6250 level at which a 10th red 'O' would have been added to the existing column of 9 red 'O's. Additionally, the H.o.D. was 6365 - 15 points above the minimum necessary for a new column of 3 bloo 'X's to print.

If, like the previous column of bloo 'X's, the bulls fail to capitalize on the reversal and, as happened during the second half of last week, they are swamped with supply, the index will quickly reverse back down again to form a new column of red 'O's. If the bulls fail to add a 4th bloo X to today's column and there is a reversal, I'll short @ 6275 with a stop @ 6375.
Tim.
 

Attachments

  • FTSE_P&F_12_11_07.jpg
    FTSE_P&F_12_11_07.jpg
    232.3 KB · Views: 164
Intra day small time frames

Purple = open hour range
RED = Swing Low on the low of open hours range

Yest Low @ 6362

Trend lines for you Split :p

Andy AKA
 
Last edited:
Day Swing with 3 Indians

Swing trade, from yesterdays high with 3 indians, great rejection of price at previous days high, entry never tested.

1st indian was home for brunch @ days pivot 6420

2nd Indian was home @ previous days Low S1 ish 6360

3rd Indian stayed on to see if Cont of trend signal any good on the breach of the Day low late in the day.

Volumes yesterday were low and closed just under low, Gapped down this morning and promising start to the days battle, had to go out and put it off long as I could, in the end moved stop to just above low yesterday @ 6335

Came home to find 3rd Indian shame faced :eek: and sat in his T - PEE,:!: :eek:

He complained that he did not have enough room to evade the 7th Cav (dow fut) scouting parties that were out all morning, :devilish:

If he could have used his pony he would have been able to give them the slip instead he had to fight in a rocky outcrop and just had no where to run to.

Looking at the charts latter I am inclined to agree with him :eek: :eek:

Red = yest Low @ 6335
purple = open hour range

Andy AKA
 
Last edited:
No Change

He complained that he did not have enough room to evade the 7th Cav (dow fut) scouting parties that were out all morning, :devilish:
Indeed Andy - I had the same problem - very frustrating!
- - - - - - - - - - - - - - - - - - - - - - - - - - - - - - - - - - - - - -
The chart is still very BEARISH. If the index drops to 6275, i.e. just one more red 'O' at the foot of the current column, a double bottom will be created and is a potential area of support. However, if it's breached, (i.e. it falls to 6250) this will generate a sell signal, making the horizontal red dotted line at 6200 the next obvious support area. The bulls will have to push the index up to 6475 for the chart to revert to bullish mode and, beyond that, all the way up to 6575 in order to breach the bearish resistance line. Suffice to say, the bears are in control and, based on the evidence in the current chart, the index is likely to drop further next week.
Tim.
 

Attachments

  • FTSE_P&F_16_11_07.jpg
    FTSE_P&F_16_11_07.jpg
    207.7 KB · Views: 132
Last edited:
Swing trade, from yesterdays high with 3 indians, great rejection of price at previous days high, entry never tested.

1st indian was home for brunch @ days pivot 6420

2nd Indian was home @ previous days Low S1 ish 6360

3rd Indian stayed on to see if Cont of trend signal any good on the breach of the Day low late in the day.

Volumes yesterday were low and closed just under low, Gapped down this morning and promising start to the days battle, had to go out and put it off long as I could, in the end moved stop to just above low yesterday @ 6335

Came home to find 3rd Indian shame faced :eek: and sat in his T - PEE,:!: :eek:

He complained that he did not have enough room to evade the 7th Cav (dow fut) scouting parties that were out all morning, :devilish:

If he could have used his pony he would have been able to give them the slip instead he had to fight in a rocky outcrop and just had no where to run to.

Looking at the charts latter I am inclined to agree with him :eek: :eek:

Red = yest Low @ 6335
purple = open hour range

Andy AKA

IMO, you are going against a trend that started on 14th. Your indians are running uphill and the 7th downhill. If you want to be a longer timescale trader why are you using a 3 minute chart? If your answer is, to get a trigger, then I would have thought that you would be using it to try to find the day's high. The 30 min chart I show has all your averages in a strong downtrend and the piercing of the 60 was rejected.
 

Attachments

  • Nov16Footsie.JPG
    Nov16Footsie.JPG
    74.1 KB · Views: 152
You having a laugh or what mate

IMO, you are going against a trend that started on 14th. Your indians are running uphill and the 7th downhill. If you want to be a longer timescale trader why are you using a 3 minute chart? If your answer is, to get a trigger, then I would have thought that you would be using it to try to find the day's high. The 30 min chart I show has all your averages in a strong downtrend and the piercing of the 60 was rejected.

Split

Got the wrong end of the stick I think Split :?:

Think you won to much money this week mate and consumed to much pop :LOL: :LOL:

Trend judged down

month low breach @ 6393 on 7th nov
week under 52 sma and rsi below 50 centre
Short term swing trend down on 7th upon breach of swing low made on 22nd Oct

Intra day trend

4hr 1 hr and 15 min (3min just for watching :D )

4HR = clearly down
1HR = clearly down
15 min =clearly down, STT and strength to be sold into in this time frame.

3 Indians = trade divided into 3 bits SHORT @ 6458 CASH :cheesy: the previous days high

Day swing entry at high of 14 th nov on the 15th @ 8:15 approx as close as you can get to being wrong in the 4hr time frame judged by 90 ema anyway. swing in pretty bog standard well written method = Linda_Bradford_Raschke Simple Swing method. :eek:

I think I found the true trend :?:

Don"t you Split :p

exit 1 indian at 6420 (days pivot) = + 38
exit 2 indian @ approach to previous days low 6384 = + 74

last indian in chart above you refer to was still fighting and I judged at the time a rally was in the building (possible washout day with wall st due to open I moved stop in to close to the action above the low of the day before.

anyway last indian stopped out @ 6348 = + 110 pts

= 222 divided by 3 = 74 pts full

All the Indians were trading with trend IMO

I am :eek: at not giving the last indian a real go by moving my stop in close.

3 min chart, well old habbit, don"t trade chart just watch action in that time frame when in trade, use to it and a fair judge when I use with 15 min & 1 hr charts so no reason to change.

The ma"s 90-60-30-10 just have them on of late to show trend days up, stops contra entry on strong trend day, just having a look at them, and they are pretty :LOL: :LOL: so might keep them :LOL:

Oh ye and figs converted to cash, was in fact close month Dec ftse trade.

One reason I did not hold trade is that I thought the price action was odd, index battled very hard the previous day to hold the low which I judge to be a 1st cont of trend signal, it closed just below the low but it was not very convincing IMO on low volumes.

The other reason was poor judgement, the last indian was a freebee and switching off the computor that day, given I did not intend to intra day trade would have been a better course of action IMO :eek: :eek: :eek:

Hope that explains trade Split, and mind how you go on those san migg.... or whatever they are called :LOL: :LOL:

Andy AKA
 
OK,OK I don't understand what you are doing with these indians. I thought you had them long. I take it all back, Andy. A great trade.

Now, if you talk about indians again I'll come over and scalp you, personally.

Regards Split
 
Thanks Split, thought it was me for a minute

:LOL: :LOL:
OK,OK I don't understand what you are doing with these indians. I thought you had them long. I take it all back, Andy. A great trade.

Now, if you talk about indians again I'll come over and scalp you, personally.

Regards Split

Hi Split

Awards in post, won"t mention them again, its causing problems I never anticipated

its causing me to get emotionally attached to them :LOL: :LOL: and thats leading to emotional trading habits :LOL: :LOL:

I was forced against my will to save the last one, he had fought so hard :LOL: :LOL:

have a good week end Split

Andy AKA
 
Major Trend Line Break

Suffice to say, the bears are in control and, based on the evidence in the current chart, the index is likely to drop further next week.
Tim.
:eek:
Yesterday's falls have resulted in the break of the main bullish support trendline which has been in place since the very start of the bull market in Spring 2003. 50 point (as opposed to my normal weekly 25pt) 3 box reversal P&F chart attached. This is only one timeframe but, at a little under 1% of the value of the index, it's an important one. It's too early to call a major trend reversal but the bulls really need to pull their socks up lest the bears start to put real pressure on the critical 6000 support zone, which is now getting a bit too close for comfort.
Tim.
 

Attachments

  • FTSE_P&F_TL_Break.jpg
    FTSE_P&F_TL_Break.jpg
    214.3 KB · Views: 157
Last edited:
Not Convinced . . .

It's too early to call a major trend reversal but the bulls really need to pull their socks up lest the bears start to put real pressure on the critical 6000 support zone, which is now getting a bit too close for comfort.
Maybe more people read my ramblings on P&F than I imagine. I wish! :cheesy:
Either that or the U.S. Thanksgiving holiday accounts - in part at least - for the bull rally at the tail end of the week in both the FTSE and the DOW. Volume on the U.S. index was understandably light on Friday (see bar chart) and Wednesday's close was right on key support at 12800. This combination of the 'holiday vibe', many key players being away from their desks, the lack of any really bad news and, most importantly, the index sitting on support - all contributed to Friday's rise. The FTSE duly obliged and followed suit, but it's got a long way to go before it's out of the woods. In spite of the latest column of 8 bloo 'X's, the chart remains BEARISH and, if the DOW turns back down to test the 12800 support zone, it's probable that the FTSE will form a new column of red 'O's next week.
Tim.
 

Attachments

  • DJI_BAR_23_11_07.jpg
    DJI_BAR_23_11_07.jpg
    126.7 KB · Views: 138
  • FTSE_P&F_23_11_07.jpg
    FTSE_P&F_23_11_07.jpg
    227.4 KB · Views: 138
Last edited:
Ah! Not a "decisive rejection" then, but an LSE computer failure with the real close (for what it's worth) at 6385.

We've been down to 6290 today so it looks like we'll have to take it that the swing trend has turned down. Need some confirmation in view of the LSE shenanigans though.

good trading

jon

Sorry guys - been very remiss in not keeping the swing story going. Sure you've been well entertained by Tim's p&f ramblings in the meantime :cheesy:

So where were we? The extremely aggressive will have gone short on the trend change mentioned above at around 6405. The less aggressive will have awaited the first retracement and will have gone short around 6330 (short white line and little red arrow) and the aggressive will have added to their position at this point.

Given the strong support at around 6000 most will have exited the bulk if not all of their positions as it approached.

We've got a long way to go - 6465 - before the swing trend changes back to up, so we're still favouring a short after a bit more in the current retracement.

good trading

jon
 

Attachments

  • ftseswing.JPG
    ftseswing.JPG
    62.6 KB · Views: 174
Well it looks messy but we got our third bar today and a potential swing high. A short would signal at around 6270 with a stop loss around 6365 which is pretty uncomfortable.

good trading

jon
 
Stops talk of the Day

Well it looks messy but we got our third bar today and a potential swing high. A short would signal at around 6270 with a stop loss around 6365 which is pretty uncomfortable.

good trading

jon

Just inquiring, is that how you apply the stop on cont of trend Jon because I no you like this signal or do you like me go in close Intra day and try and get a head start :?:

Or am I just a yellow belly :LOL: :LOL:

Me I would look to short tomorrow at around todays highs if I detect any weakness around there or if an early breach of the todays Low, wait till at least the 1st hours printed and try and enter on 1st reaction


Andy AKA
 
In one Indian only

Just inquiring, is that how you apply the stop on cont of trend Jon because I no you like this signal or do you like me go in close Intra day and try and get a head start :?:

Or am I just a yellow belly :LOL: :LOL:

Me I would look to short tomorrow at around todays highs if I detect any weakness around there or if an early breach of the todays Low, wait till at least the 1st hours printed and try and enter on 1st reaction


Andy AKA

In at cash 6404 short, Stop 25 but look to be out at BE to -12

Fishing with one indian, see how he goes a head of news and Wall st open :LOL:

Will remove double quick :LOL: dancing time :D

Andy
 
In at cash 6404 short, Stop 25 but look to be out at BE to -12

Fishing with one indian, see how he goes a head of news and Wall st open :LOL:

Will remove double quick :LOL: dancing time :D

Andy

Andy, I'll take your word for it, I'm closing out my position until Monday. I'd like an easy afternoon at work!

Split
 
Status
Not open for further replies.
Top