You are using an out of date browser. It may not display this or other websites correctly.
You should upgrade or use an alternative browser.
You should upgrade or use an alternative browser.
If you break the rules you have to pay the price.
Placed my buy order too low due to a silly miscalculation: it was triggered but then stopped out when we (just) broke below Tuesday's low this pm. Annoyingly, the S&P looks positive and I expect we will break above the Thursday low on Friday, making a swing low to match the US. I am therefore breaking the rule again and am already long on the FTSE in anticipation.
I think I may be drinking too much coffee.
All the oil and mining stocks are falling this morning, which makes the Footsie go lower because they are the most capitalised, whereas most of the other shares are going up. I was short some shares yesterday, only to see some of my stops triggered this morning.
barjon
Legendary member
- Messages
- 10,752
- Likes
- 1,863
The swingtrend is still up, split, despite the fairly precipitate retracement. So I've been favouring longs with the shares, caught out on a few, but others have come good this am.
ftse long signal doesn't comes 'til 6131+ on eod basis (always assuming yesterdays potential swing low is confirmed)
good trading
jon
ftse long signal doesn't comes 'til 6131+ on eod basis (always assuming yesterdays potential swing low is confirmed)
good trading
jon
Split - Yes, falling oil prices drag the FTSE down at first - as far as the point where the oil majors' pain is balanced by the reduced overheads for everyone else in the index, who are users rather than producers. I would love to see that relationship plotted on a chart in place of some of these MAs we're all so keen on. I could play around in Sharescope and see what it might look like but has anyone done this already?
barjon
Legendary member
- Messages
- 10,752
- Likes
- 1,863
It'd be interesting, tom, but very head scratching 😱
Since the index constituents have an influence according to their capitalisation the main movers are BP, HSBC and VOD. In the top 15 caps are: 3 banks, 4 miners and 2 oils and 2 pharmas. Two high performing sectors vs two poor performing!!!!
good trading
jon
Since the index constituents have an influence according to their capitalisation the main movers are BP, HSBC and VOD. In the top 15 caps are: 3 banks, 4 miners and 2 oils and 2 pharmas. Two high performing sectors vs two poor performing!!!!
good trading
jon
The swingtrend is still up, split, despite the fairly precipitate retracement. So I've been favouring longs with the shares, caught out on a few, but others have come good this am.
ftse long signal doesn't comes 'til 6131+ on eod basis (always assuming yesterdays potential swing low is confirmed)
good trading
jon
Just the man I was hoping would show up. 🙂
What do you use, (if it's not classified information) to tell the difference between a swing, which is a reversal, and a pullback, which is a continuation?
Always makes me ponder.
Split
Split - Yes, falling oil prices drag the FTSE down at first - as far as the point where the oil majors' pain is balanced by the reduced overheads for everyone else in the index, who are users rather than producers. I would love to see that relationship plotted on a chart in place of some of these MAs we're all so keen on. I could play around in Sharescope and see what it might look like but has anyone done this already?
That's for youngsters. 😀
Slightly OT, but I know you dabble, I just went long on SP, to see if I can get into profit by the open, so that I can put a breakeven stop on before going to work. Sometimes works, sometimes doesn't.
barjon
Legendary member
- Messages
- 10,752
- Likes
- 1,863
Just the man I was hoping would show up. 🙂
What do you use, (if it's not classified information) to tell the difference between a swing, which is a reversal, and a pullback, which is a continuation?
Always makes me ponder.
Split
🙂
Just off to golf, split (while you go to work!!), but I'll reply later.
Cheers
jon
Good luck Split.
I am trying to discipline myself not to go for daytrades but am occasionally still tempted. However, I find the S&P points the way for the FTSE, at least on EOD basis so sometimes end up taking a swing signal on the S&P if it gets confirmation before the FTSE chart. S&P is a couple of days ahead of FTSE into upswing and I should have been (but am not) long on the S&P from a few days back. Ho hum.
I am trying to discipline myself not to go for daytrades but am occasionally still tempted. However, I find the S&P points the way for the FTSE, at least on EOD basis so sometimes end up taking a swing signal on the S&P if it gets confirmation before the FTSE chart. S&P is a couple of days ahead of FTSE into upswing and I should have been (but am not) long on the S&P from a few days back. Ho hum.
barjon
Legendary member
- Messages
- 10,752
- Likes
- 1,863
Just the man I was hoping would show up. 🙂
What do you use, (if it's not classified information) to tell the difference between a swing, which is a reversal, and a pullback, which is a continuation?
Always makes me ponder.
Split
split
Right, back from golf with a bit of time before another nine holes this evening - left my clubs out at the club and with a bit of luck someone will pinch them 😈
When we've got an established swingtrend ("established" - ah, that's another story 😕) I assume each retracement to be a "pullback" until it proves otherwise. I wait for 3+ bars of "pullback" when the low bar becomes a potentional swing low (in an uptrend). That potential gets confirmed as a swing low, a: by the price moving above the high of that "potential swing low" (where the aggressive will enter long) and then b: by a close above that high (where the more cautious will enter). It's still only a potential continuation of the trend until price goes on to make a new high for the trend, which finally confirms the continuation.
Once a potential swing low has been confirmed (a & b above) and the price has moved up for a couple more days a retreat which takes out the confirmed swing low low point signals a potential change of swingtrend to down and therefore a confirmed reversal.
That's about it, but you will spot the areas where "discretion" comes into it as well.
good trading
jon
Thanks for your reply, Jon. I think that your assumption that they are all pullbacks until proved otherwise, with some discretion thrown into the mix, is the wisest way to go.
I am, always, trying to read things into a chart that, simply, are not there. It's about time that I started assuming, myself!
Split
As an addition. Where you mentioned, earlier, that the "swing low" trigger was 6131, until it does we should be assuming that this is, still a potential pullback that would be triggered at 6053.5?
Wow! The stops that this involves:whistling
Last edited:
Good luck Split.
I am trying to discipline myself not to go for daytrades but am occasionally still tempted. However, I find the S&P points the way for the FTSE, at least on EOD basis so sometimes end up taking a swing signal on the S&P if it gets confirmation before the FTSE chart. S&P is a couple of days ahead of FTSE into upswing and I should have been (but am not) long on the S&P from a few days back. Ho hum.
Just to give an example of the value of the S&P. Have a look at the FTSE and S&P candlestick charts showing 19/05. The FTSE established its candlestick by 4:30pm that day of course. It shows a gap at the open above the close of the previous session 16/05, a minor retracement to only a couple of points below the 16/05 close and a close within a whisker of the high of the day. All distinctly bullish and suggesting nothing more than a continuaiton of the established upleg.
The S&P candlestick for 19/05 however printed a shooting star, with a significant rise from the open, falling back to leave a small advance only on the day. This was also the bearish confirmation of the S&P's 16/05 hanging man candlestick, which the FTSE did not print and seemed to contradict on the 19th.
On the 20th, the FTSE followed the S&P's prediction, not its own, and fell like a stone, three times as far in percentage terms as the S&P, and twice as far as the Dow. The percentage differences confirm the correctness of our selection of the FTSE as the primary instrument for trading, but the TA shows a blinkered approach will not be sufficient.
barjon
Legendary member
- Messages
- 10,752
- Likes
- 1,863
split
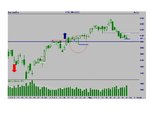
You'll see from the chart that the penultimate candle (H 6131, L 6041) still stands as a potential swing low since its low was not breached by the last candle. A long would trigger at 6131+, but if the price falls below 6041 that would nullify the potential swing low and a new potential swing low is formed (assuming it hasn't gone below the last confirmed swing low - circled - at 5952).
However, now for the discretion. There are reasons to be very cautious about a long trade:
1. The earlier - circled - swing low was a very scrappy affair and the current close sits very close to the close of that swing low.
2. A minor swing low - dotted blue line - where we only got two lower lows has been breached.
3. The last three candles have been relatively tight (possible flag before further fall) with the last four closes within a 16 point range.
4. On the plus side, there's been an enormous amount of activity at 6000 + and -, so I think that's a key number so far as potential support goes.
I'll probably still take a "tester" trade if 6131 goes intraday, but I'll be interested in where it closes and reserve most of the ammunition 'til after that.
good trading
jon
Attachments
split
You'll see from the chart that the penultimate candle (H 6131, L 6041) still stands as a potential swing low since its low was not breached by the last candle. A long would trigger at 6131+, but if the price falls below 6041 that would nullify the potential swing low and a new potential swing low is formed (assuming it hasn't gone below the last confirmed swing low - circled - at 5952).
However, now for the discretion. There are reasons to be very cautious about a long trade:
1. The earlier - circled - swing low was a very scrappy affair and the current close sits very close to the close of that swing low.
2. A minor swing low - dotted blue line - where we only got two lower lows has been breached.
3. The last three candles have been relatively tight (possible flag before further fall) with the last four closes within a 16 point range.
4. On the plus side, there's been an enormous amount of activity at 6000 + and -, so I think that's a key number so far as potential support goes.
I'll probably still take a "tester" trade if 6131 goes intraday, but I'll be interested in where it closes and reserve most of the ammunition 'til after that.
good trading
jon
Thanks, Jon, I understand your ideas.
My opinion on this is that a new down trend started when, seven days after the recent high, there has been no serious attempt to penetrate highter ground. A contra move, marked by your white line, fizzled out after only a half hearted attempt. Still, weak or not, I am taking it as a pullback to be followed by a short trade if the underside of this is breached.
This does not mean that a lot of shares would not go up if the oil price collapsed, but it does, IMO, mean that the index will fall due to the fact that the highest capitalised stocks are petroleras and mines.
Anyway. All will become clear. 🙂
Split
barjon
Legendary member
- Messages
- 10,752
- Likes
- 1,863
Fair enough, split. We're about in that that key +6000- zone that'd put me off a serious short if I'd been thinking about it at the moment. Still, knowing you, you'll come up smelling of roses and won't have one of those "wow" stops to worry about either :cheesy:.
good trading
jon
good trading
jon
barjon
Legendary member
- Messages
- 10,752
- Likes
- 1,863
.........On the 20th, the FTSE followed the S&P's prediction, not its own, and fell like a stone, three times as far in percentage terms as the S&P, and twice as far as the Dow. The percentage differences confirm the correctness of our selection of the FTSE as the primary instrument for trading, but the TA shows a blinkered approach will not be sufficient.........
Tom,
Yeah, been doing that quite a bit on the downside recently, although not so severe.
Ftse usually shadows dow/s&p pretty much when US market is open. Sometimes, though, you see a five minute dramatic fall in the dow/sp which ftse doesn't believe and holds pretty firm. The dow/s&p usually bounces straight back and although I don't trade them I'd certainly take note of ftse's disbelief if I did 😉
good trading
jon
Well, the old saying is that the market climbs a wall of worry. There's, certainly, a load of worry around at present so you will ,probably, be the ones who are right.
Split