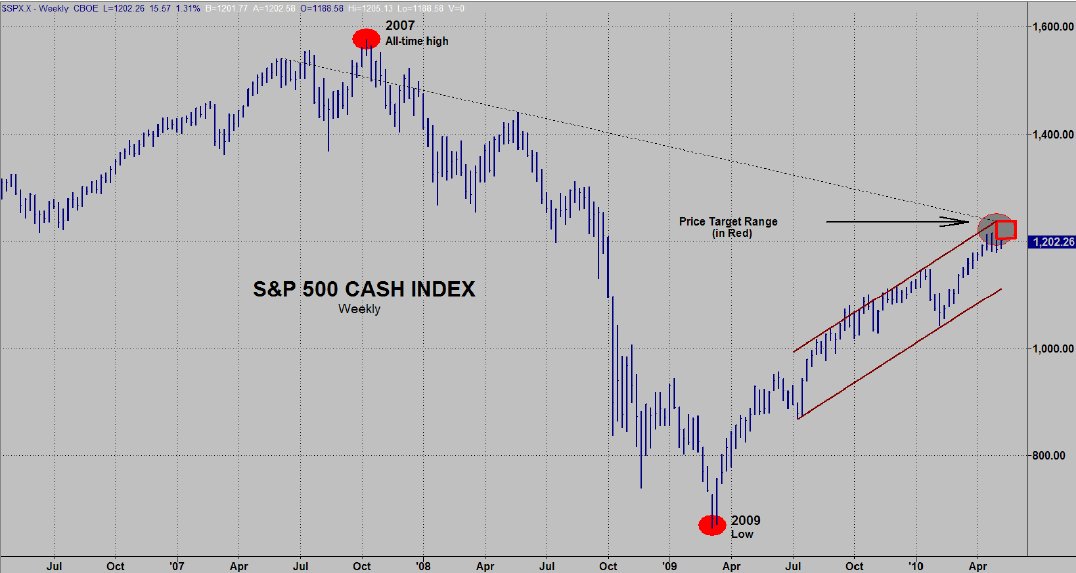
Since my last Special Alert which was written at the start of May with the theme of SELL IN MAY AND GO AWAY, I have had a lot of calls and e-mails asking if I had written another since. I had not because I saw no reason to veer from the message in the prior Alert. The early May Alert was probably the most technical Alert I have written and I concentrated on the monthly charts. That is not something I usually do. Typically, I only refer to a monthly chart when I think that "bigger picture" viewpoint is seriously worthwhile. My focus was almost exclusively on the monthly charts because I believe the April 26th high was the orthodox top for the recent "reprieve rally" that began with the March 2009 low. When I went over my monthly charts and saw the amazing convergences in the various charts, I was quite surprised. The chart below is from that Alert and sums up all of those charts with the highlighted target range - which had already been reached at the end of April. Look at the same updated chart that follows - a great deal has happened since May. The S&P was above 1200 when I was writing that Alert. At today's low it was just under 1011 - a drop of almost 16%. A number of technical levels have been violated.
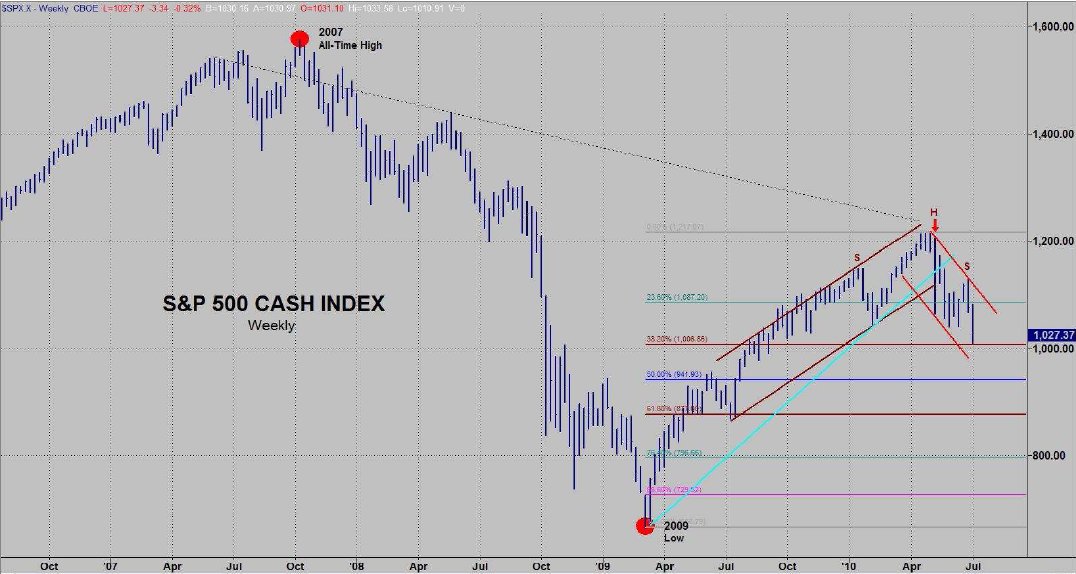
The lower channel line (lower brown line) from the prior chart has been broken. Just prior to its break, the uptrend line (light blue line) was broken. Next, a down channel (red lines) has been established. In addition, an argument can be made that a head and shoulders pattern is being made and that it projects all the way down to the 61.8% Fibonacci retracement line (the lower brown horizontal line). Elliott Wave analysts can make the argument that we are in wave 3 to the downside (which is the wave associated with aggressive downside moves). It is common knowledge among technical analysts that crashes come from lows, not highs. We are set up potentially for a crash - that cannot be ruled out. Let's look at a daily chart:
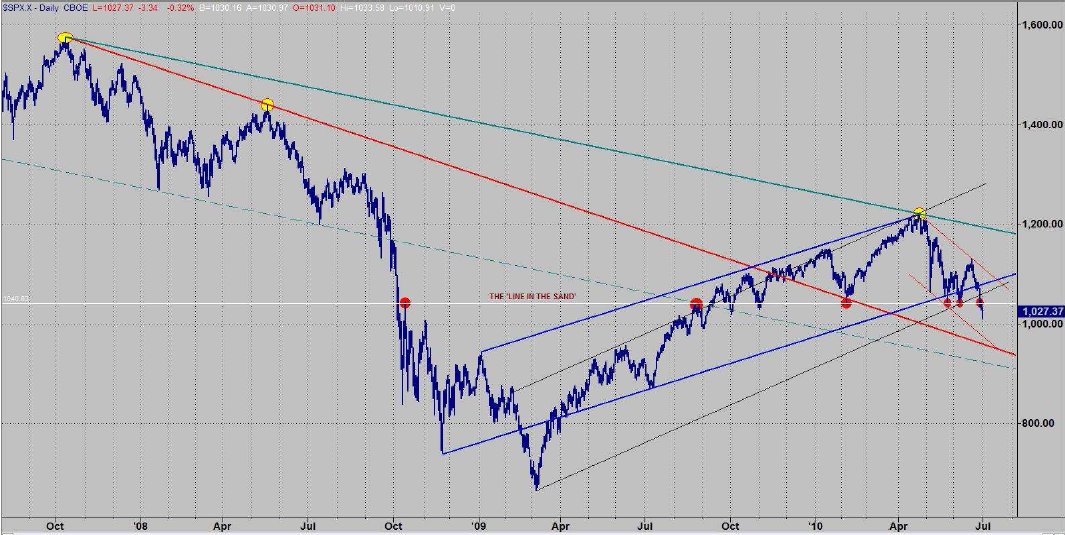
The daily chart is also biased to the bearish side. The market is clearly in a down channel and has broken below the lower blue channel line that has confined prices since the November 2008 low (with the obvious exception of the final bear thrust culminating in the March 2009 low). Otherwise, it has been an exceptional price channel. It was initially broken on May 25th but quickly found support at the 1040 level. It again broke the channel leading to the June 8th low at the 1042 level. Two days ago the 1040 level was broken. This was the "line in the sand" and it has been penetrated to the downside. With respect to Dow Theory, both the Dow Jones Industrials and the Dow Jones Transports made new closing lows. This, of course, is a very negative sign as well as a downside confirmation. So, with all this negativity, is there anything bullish occurring? I believe there is - at least the potential exists. The market is finally short term oversold. The TRIN readings have been extreme and VIX numbers have set up a buy signal. A turn up in prices at this level produces a divergent buy signal. The chart below shows the daily S&P bars as well as the daily closing prices (in white).
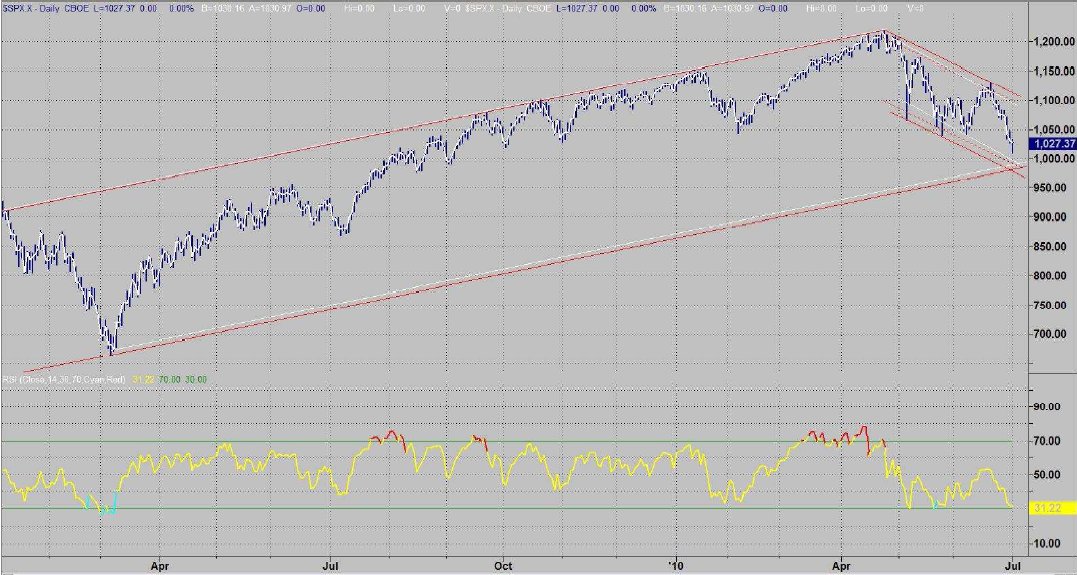
The red trend lines are based on the daily bars and the white trend lines are based on the daily closing prices. The broad upward channel and the recent down channel are clearly shown. The purpose of the chart, however, is to show the convergence of lines under current prices. This provides support in both price and time. Near term, if the market decides to test lower prices, the 990 level would be a good bet to hold. Otherwise, we may have already begun a turn to the upside.
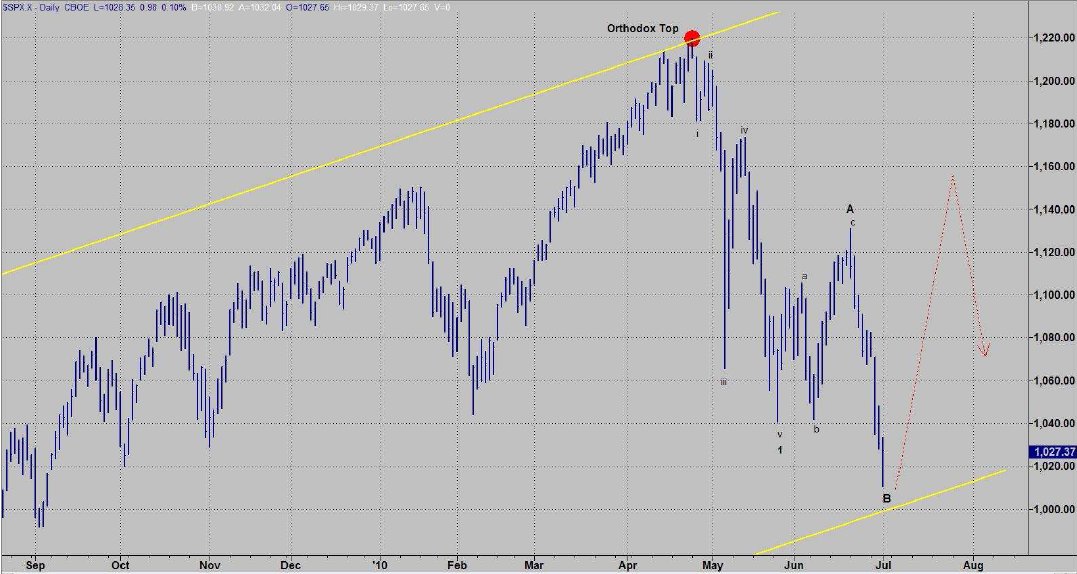
The following chart shows two yellow trend lines that are based off a lower speed resistance line. The lower line adds to the support argument near current prices. The rest of the chart shows my Elliott Wave count from the late April high. I view the recent thrust to the June 21st high to be an A wave and this current decline to be a B wave. That implies a C wave rally. If this count is correct, I have no idea where the C wave will take us. In a best case scenario, you could get up to prices above the recent A wave. I drew in my expectations under such a scenario.
My major turning points for this year were May and August. With my last Alert it was apparent that the late April top would be significant and, in my view, is the orthodox top of this reprieve rally from March 2009. I have had August 2010 as a significant date in my longer term work for about two years. I see no reason to change that expectation. Since my May expectation came in a bit early, I am putting my "early warning date" for August in the July 26th general time frame (based on the April high). The obvious caveat at this late stage of the game is to constantly be on the lookout for a crash or at least the return of a bearish trend. I expect to have my Part II of the Sequence of Events in the Cycle completed soon and it will contain some serious warnings.
Garrett Jones can be contacted by Email


The lower channel line (lower brown line) from the prior chart has been broken. Just prior to its break, the uptrend line (light blue line) was broken. Next, a down channel (red lines) has been established. In addition, an argument can be made that a head and shoulders pattern is being made and that it projects all the way down to the 61.8% Fibonacci retracement line (the lower brown horizontal line). Elliott Wave analysts can make the argument that we are in wave 3 to the downside (which is the wave associated with aggressive downside moves). It is common knowledge among technical analysts that crashes come from lows, not highs. We are set up potentially for a crash - that cannot be ruled out. Let's look at a daily chart:

The daily chart is also biased to the bearish side. The market is clearly in a down channel and has broken below the lower blue channel line that has confined prices since the November 2008 low (with the obvious exception of the final bear thrust culminating in the March 2009 low). Otherwise, it has been an exceptional price channel. It was initially broken on May 25th but quickly found support at the 1040 level. It again broke the channel leading to the June 8th low at the 1042 level. Two days ago the 1040 level was broken. This was the "line in the sand" and it has been penetrated to the downside. With respect to Dow Theory, both the Dow Jones Industrials and the Dow Jones Transports made new closing lows. This, of course, is a very negative sign as well as a downside confirmation. So, with all this negativity, is there anything bullish occurring? I believe there is - at least the potential exists. The market is finally short term oversold. The TRIN readings have been extreme and VIX numbers have set up a buy signal. A turn up in prices at this level produces a divergent buy signal. The chart below shows the daily S&P bars as well as the daily closing prices (in white).

The red trend lines are based on the daily bars and the white trend lines are based on the daily closing prices. The broad upward channel and the recent down channel are clearly shown. The purpose of the chart, however, is to show the convergence of lines under current prices. This provides support in both price and time. Near term, if the market decides to test lower prices, the 990 level would be a good bet to hold. Otherwise, we may have already begun a turn to the upside.
The following chart shows two yellow trend lines that are based off a lower speed resistance line. The lower line adds to the support argument near current prices. The rest of the chart shows my Elliott Wave count from the late April high. I view the recent thrust to the June 21st high to be an A wave and this current decline to be a B wave. That implies a C wave rally. If this count is correct, I have no idea where the C wave will take us. In a best case scenario, you could get up to prices above the recent A wave. I drew in my expectations under such a scenario.

My major turning points for this year were May and August. With my last Alert it was apparent that the late April top would be significant and, in my view, is the orthodox top of this reprieve rally from March 2009. I have had August 2010 as a significant date in my longer term work for about two years. I see no reason to change that expectation. Since my May expectation came in a bit early, I am putting my "early warning date" for August in the July 26th general time frame (based on the April high). The obvious caveat at this late stage of the game is to constantly be on the lookout for a crash or at least the return of a bearish trend. I expect to have my Part II of the Sequence of Events in the Cycle completed soon and it will contain some serious warnings.
Garrett Jones can be contacted by Email
Last edited by a moderator:
