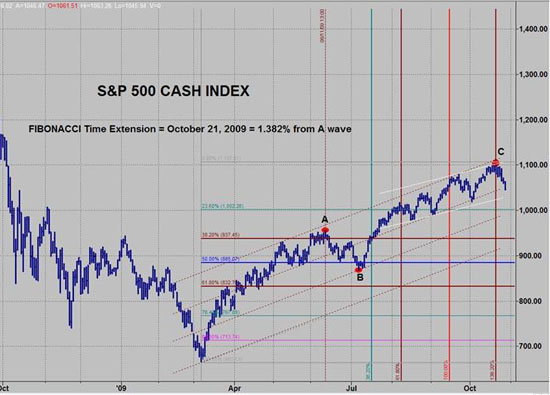
I began putting the DANGER signal on my Special Alerts to "alert" everyone to Danger (duh). I know this stage of the market well as I have seen it time and time again in many different markets. As I said over and over, "the job of this rally is to draw in as many players as possible" (and then give them a thorough drubbing for being so foolish). There were two "turning points" to potential tops (August 7 and mid September). Both were tops, but only temporarily (very temporarily).
MARKET TOP - (The title of this article), I can't get much more "up front" than that it means that everything I was looking for to produce a market top had occurred and that anything beyond that would send me back to the drawing board. I now think the odds are strong that we will now see what I have alluded to in the 40 year cycles i.e. "every 40 years or so something bad happens" - "every other 40 years (every 80 years) something really bad happens."
In my view, we are entering a very dangerous time where extraordinary steps have to be taken. If you are glued to the TV set to expect to be led to safe harbors, then you are very likely missing the point. The talking heads didn't warn you of the top in 2000; they didn't warn you of the top in 2007 and they haven't warned you now. Why? Because they have no basis to make such a warning and the next top they call will be their first.
If you have not memorized the Sequence of Events in the Cycle and are not seriously paying attention to where we are in this cycle, you may be making a serious mistake. This is not a time to buy into the propaganda. This is a time where the following suggestions 1) get your safe money safe. "Safe" may require a lot more thought than what you may be thinking. 2) After you get into a safe custodian, then worry about the vehicles.
I have a friend who constantly tells me to tell my readers where to put a stop. I have hesitated from doing that because I have a very smart readership that knows that "discipline is more important than brains" at least, when dealing with the stock market. My view is to protect profits with trailing stops no matter what direction the market is headed. If you got short last week, then a stop at the 1100 resistance would make sense. If you want to give it a little room, then 1105. If you are more aggressive, then a lower number will work.
In looking at the short term, partner Peter Eliades shares "Today's advance/decline numbers so far bring the ratio adjusted McClelland Oscillator to under 100. After the August 25, 1987 top, 9 trading days later the ratio adjusted McClelland Oscillator read 102.8" It made a short term bottom there. We may be close to such a bottom, but let's not lose sight of the fact that the risk is to the downside.

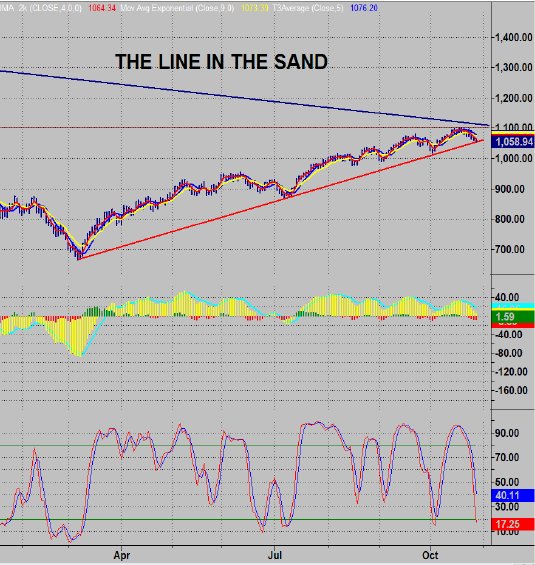
Looking at the following chart, the market is confined by the tops line which is now approaching the 1100 resistance level, strengthening both as barriers to the market on the upside. The Line to watch is the Red line that is the "line in the sand". If it is broken now, we go down and possibly, sharply. The next turning point target is November 13. The market is short term oversold and it would appear likely to rally into the 3rd or 4th of November and then have a decline that cleanly breaks the Red trend line. The rally back up to 5 and C is a best case scenario. My strong belief is that the top is already in (October 19th close and October 21st intraday)

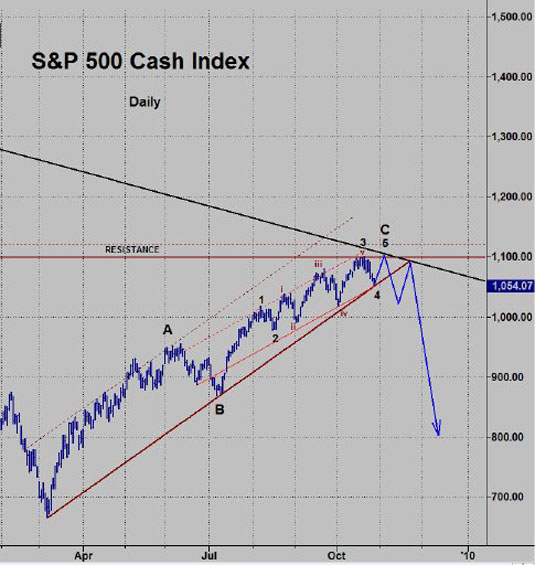
The following chart shows the market getting support right here and a rally into November 3rd or 4th. That would be ideal with other technical work that I have however, ideal doesn't always happen, so the key now is risk avoidance. The caveat is that we may just go down from here. The break of the trend line is the key. Otherwise, we have a down up move now and, hopefully, another such move from the November 13 time frame. After that bounce (if it happens), I expect a very hard move to the downside.

MARKET TOP - (The title of this article), I can't get much more "up front" than that it means that everything I was looking for to produce a market top had occurred and that anything beyond that would send me back to the drawing board. I now think the odds are strong that we will now see what I have alluded to in the 40 year cycles i.e. "every 40 years or so something bad happens" - "every other 40 years (every 80 years) something really bad happens."
In my view, we are entering a very dangerous time where extraordinary steps have to be taken. If you are glued to the TV set to expect to be led to safe harbors, then you are very likely missing the point. The talking heads didn't warn you of the top in 2000; they didn't warn you of the top in 2007 and they haven't warned you now. Why? Because they have no basis to make such a warning and the next top they call will be their first.
If you have not memorized the Sequence of Events in the Cycle and are not seriously paying attention to where we are in this cycle, you may be making a serious mistake. This is not a time to buy into the propaganda. This is a time where the following suggestions 1) get your safe money safe. "Safe" may require a lot more thought than what you may be thinking. 2) After you get into a safe custodian, then worry about the vehicles.
I have a friend who constantly tells me to tell my readers where to put a stop. I have hesitated from doing that because I have a very smart readership that knows that "discipline is more important than brains" at least, when dealing with the stock market. My view is to protect profits with trailing stops no matter what direction the market is headed. If you got short last week, then a stop at the 1100 resistance would make sense. If you want to give it a little room, then 1105. If you are more aggressive, then a lower number will work.
In looking at the short term, partner Peter Eliades shares "Today's advance/decline numbers so far bring the ratio adjusted McClelland Oscillator to under 100. After the August 25, 1987 top, 9 trading days later the ratio adjusted McClelland Oscillator read 102.8" It made a short term bottom there. We may be close to such a bottom, but let's not lose sight of the fact that the risk is to the downside.

THE LINE IN THE SAND
Looking at the following chart, the market is confined by the tops line which is now approaching the 1100 resistance level, strengthening both as barriers to the market on the upside. The Line to watch is the Red line that is the "line in the sand". If it is broken now, we go down and possibly, sharply. The next turning point target is November 13. The market is short term oversold and it would appear likely to rally into the 3rd or 4th of November and then have a decline that cleanly breaks the Red trend line. The rally back up to 5 and C is a best case scenario. My strong belief is that the top is already in (October 19th close and October 21st intraday)

The following chart shows the market getting support right here and a rally into November 3rd or 4th. That would be ideal with other technical work that I have however, ideal doesn't always happen, so the key now is risk avoidance. The caveat is that we may just go down from here. The break of the trend line is the key. Otherwise, we have a down up move now and, hopefully, another such move from the November 13 time frame. After that bounce (if it happens), I expect a very hard move to the downside.

Last edited by a moderator:
