Elliott Wave Analysis

USDCAD Wave Count

Our USDCAD count shows the difference between trading and analysis. While we have a completed rally into the January high, it was accompanied by Sustainable Bull readings on RSI, with no divergence. Then, prices collapsed in a relentless selloff, with multiple Sustainable Bear readings, and no divergence into the low. So, even though we've been expecting this wave B rally for sometime from an analysis perspective, we haven't once become aggressively bullish. As traders, when a picture isn't crystal clear - DO NOT TRADE IT. A mentor once compared trading to fishing. Most of the time you're sitting around, waiting for a bite, you're not constantly reeling 'em in, right? So, we're expecting a further bounce to complete B, but is wave (b) of B complete? Is the rally going to a new high per the Sustainable Bull reading? Too many questions, when the counts elsewhere are clear.
CAD.PNG
 
USDJPY Wave Count

There's still only three waves up from the low, but we think we're going to see a small wave higher to complete wave (i) or (a), prior to the (ii)/(b) decline. Perhaps a deep retracement for wave (ii) would test the low, prior to a significant move higher on some more idiocy by the BOJ. We'll see. Instead, if price drop below 107.46, then maybe the ending diagonal for 5 is per the alternate count with the wave 4 high where we have (ii) of 5 now. Either way, the next week or two should be range-bound.
JPY.PNG

Happy Trading!

The Wolf
 
EURUSD Wave Count

There's no change to our bearish view, and we can now lower critical resistance to the wave (i) low at 1.1386. If our top count, and bearish view, is correct, then prices are unlikely to see that level again until the ultimate low near parity. Look for the up trendline to provide some support, but rallies should be corrective.

From a bigger picture perspective, EURUSD has been trading sideways for quite some time. Rather than seeing this as a consolidation that will lead to much lower levels, we see this as part of a bottoming process. A new low near parity is still the call, but look for the decline to be a choppy one rather than a trending type of a move.
EUR.PNG
 
GBPUSD Wave Count

Prices pushed higher intra-week, prompting quite a bit of doubt in our bearish view. However, Friday's reversal leaves us with the impression that bears are still in control. Recall the importance we put on Friday closes, and see that traders were unwilling to go into the weekend long. As such, we'll hold to our bearish view while prices are below the red down trendline. A push above that would mean that wave (4) up is still underway, although ultimately a bearish resolution comes under that count too.

The reason we keep these Elliott wave charts is to provide Context to a situation, to see if they "tell" us anything important. Sometimes, when in doubt, doing nothing is the only thing to do. In addition, we always like to think in terms of scenario planning with our top count. In other words, our top count is 60-75% likely in GBPUSD, but there are ALWAYS other counts. For instance wave C of (4) up, is 15-25% likely, while a (1) (2), 1 2, count up off the low is also a 5-10% probability (with others possible too (like a wave (4) triangle)). Thinking in this manner prevents one's ego from becoming too invested in their top count, which as traders is important. Flexibility in one's thinking, or scenario planning (what can go wrong with my trade), is the only way to go.
GBP.PNG
 
AUDUSD Wave Count

Aussie continues to trade heavy, registering Sustainable Bear readings on RSI (lower grey zone). We're going to get a wave 2 bounce at some point, but we doubt it's going to produce much of a rally given the nature of the decline. We think the larger downtrend has the bears in control, and any bounce is an opportunity for the bears. Unlike GBPUSD, Aussie's picture is much clearer, and will likely continue to lead to the downside.
AUD.PNG
 
NZDUSD Wave Count

Notice the relative strength of NZD versus AUD. Prices are still headed lower, in our opinion, but kiwi's ability to remain sticky to the upside likely means Aussie has further to fall. Still the action down from the wave (ii) high appears to be nearing a complete impulse, and the continued inability to close back above the up trendline is trouble for the bulls. Any move back above the .6860 level would be us on alert for something less bearish. Until then, remain bearish.
NZD.PNG
 
USDCAD Wave Count

USDCAD didn't stop at our cited "Huge Support," but prices are comfortably back above it now. Also, notice how the wave (b) reversed up from just below that horizontal red line. We're looking for further upside this week, to be followed by a small downward correction. Wave (c) will equal wave (a) at 1.3325, which is a common relationship in zigzags. Only a drop back below the 1.2837 level will call the rally into question.CAD.PNG
 
USDJPY Wave Count

We are confident that an impulsive rally up from the low is complete. So, now, we should allow for a corrective decline which should retest the broken red up trendline. Then, we should prepare to short yen as a big rally will be possible. Some pundits have suggested that there was a central banker agreement at the G-20 meeting in China several weeks ago. And, with the recent G-7 meeting, perhaps it has been suggested that the Japanese should refrain from "manipulating" the yen weaker.

But, at some point in this currency war, it's going to be every country for himself, and the Japanese will debase the yen substantially. When they do, we can look for something disorderly to the upside in USDJPY. Let's err on the side of being yen bearish for the next decade or so.
JPY.PNG
Happy Trading!

The Wolf
 
We are confident that an impulsive rally up from the low is complete. So, now, we should allow for a corrective decline which should retest the broken red up trendline. Then, we should prepare to short yen as a big rally will be possible. Some pundits have suggested that there was a central banker agreement at the G-20 meeting in China several weeks ago. And, with the recent G-7 meeting, perhaps it has been suggested that the Japanese should refrain from "manipulating" the yen weaker.

But, at some point in this currency war, it's going to be every country for himself, and the Japanese will debase the yen substantially. When they do, we can look for something disorderly to the upside in USDJPY. Let's err on the side of being yen bearish for the next decade or so.
View attachment 224874
Happy Trading!

The Wolf
Hi Trader Skillset, I see you are here as well. You are posting in my strictly elliott wave thread on babypips. Good to see your posts. I have the same idea as you that USDJPY is soon going to lift off. In the long-term there could be a substantial rise in the Value of the Dollar. Especially with interest rates boiling in the US. The Japanese are more about fiscal policy, so unless they do something crazy like add more stimulus, then the FED has to simply offer clear direction, it could easily be 115.00, then your 3rd wave is probably alight. Great stuff!
 
EURUSD Wave Count

The trendline offered more support than we thought it would. Still, we see the bounce as a corrective wave 2 with either Friday's high wave iii of (c) of 2, or that we should see that top early week. Any push past the 61.8% retracement will begin to argue that something less bearish is taking place.

We've argued against the idea of any "policy divergence" in the US as the economy isn't healthy enough to allow the Fed to raise rates (since it will refuse to raise rates to actually cause a recession). But, there's still the matter of the under-capitalized European banks and slow growth in the EU, which we believe will cause upcoming euro weakness.EUR.PNG
 
EU Banks

For example, take a look at the following charts of three European banks, DB, CS and BBVA:
DB.PNG
CS.PNG
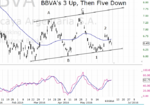
BBVA.PNG
With all three, their consolidations point lower, and potentially much lower. All of these consolidations happened in an economic environment that has been at least benign. Should economic conditions deteriorate which, given our Junk Bond Bubble thesis, we think it will, they all three could require additional capital. In a similar manner to Noble Group's "surprise" capital raise last week at a 63% discount to the market, or a sovereign bailout. Either way, those actions will likely be viewed as "euro" negative.
 
GBPUSD Wave Count

It's possible that the pound is going to seek higher prices, but we're not going to flip to that view yet. Prices have repeatedly turned back down from near the red horizontal line, and this one seems to end that way too. Look for prices to finish off some final subdivisions higher early next week, followed by a bearish reversal. We will likely avoid this pair given the upcoming news risk.
GBP.PNG
 
AUDUSD Wave Count

Prices only tested the lows prior to the upside reversal, but we continue to think Aussie is headed lower, and potentially a lot lower. We have a five wave impulse down from the wave (B) high, and prices are now back into trendline and structural resistance. We do need to allow for prices to push a bit higher before the wave 2 top is struck, but we're looking for an opportunity to return to an aggressively bearish stance. Notice the many Sustainable Bear readings into the wave 1 low. In addition, if you back out to a weekly chart it's bearish too.

We're looking for a reversal bar and follow through to the downside to confirm our count. That's really what we're always looking for: The market to act on our perceived view as quantified by Elliott waves. Rather than think of Elliott waves as the end all, they are more a way to think about markets. If the market doesn't confirm your Elliott count, what good is it? Do you want to fight a market for months or years? We don't. We'd rather understand that markets can trade against fundamentals, and it's only when the market begins to recognize the underlying deterioration in fundamentals does it matter. In other words, "the trend is your friend; don't fight your friend." The "downward reversal bar/follow through bar" would be our clue that the market recognizes AUDUSD is heading to new lows. And, at that point, it gives us a logical risk control (i.e. stop) level.
AUD.PNG
 
NZDUSD Wave Count

The action down from the wave C high looks like a three wave correction that's complete, given the blast higher last week. As such, without an immediate downside reversal that takes out the wave X? low, we're going with the above view. That view certainly questions our other dollar strength view and does give us a bit of pause. Nonetheless, we'd look to play weak dollar themes here, while using AUDUSD to express strong dollar ones. That potentially presents an opportunity for a stonger NZD versus AUD.
NZD.PNG
 
USDCAD Wave Count

We now have what looks like a completed wave B with the significant turn down Friday. We're either headed lower directly in C, or potentially an (x) wave in a larger B. Both call for lower prices near term, and we can hold a bearish view against Thursday's high. There was no Sustainable Bull reading on RSI, and it appears ready to drop back below the 50 line, which is bearish. This seems to argue in favor of commodity and NZD strength.
CAD.PNG
 
USDJPY Wave Count

Speaking of listening to the market, we won't ignore the message in USDJPY. The failure below the April high leaves yet another lower high on the chart. No Sustainable Bull reading from daily RSI suggests lower still into an ugly looking wave 5 diagonal, or some other pattern we've yet to discern. What's clear is that the market doesn't care about the fact that the yen will ultimately become worthless - yet. So, don't fight that trend, and allow for a small bounce as a bearish opportunity. The prior fourth wave of the wave I rally is either 101 or 94, so even a drop to those levels won't change the larger yen bearish view - that is, that the USDJPY is going to 150.00-175.00 in its next wave up.
JPY.PNG
Happy Trading!

The Wolf
 
Top