Elliott Wave Analysis

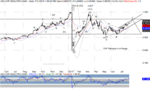
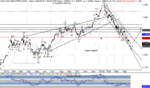
USDCHF Daily Wave Count

Rather than commenting on the rather untradeable USDCHF, I'll pose the dilemma below instead.

Coming into 2015, we were berating the Swiss National Bank (SNB) for its idiotic euro peg. We thought it would continue with the peg since the SNB actually wanted a weaker franc. As a result, it electronically printed francs to buy euros, which were falling in value. Then in January the SNB changed its tack. Instead of buying a falling euro, it chose to buy stocks instead. Now, given 21 years in various facets of the investment world, I consider myself a savvy veteran of this world. But, I can't for the life of me figure out why any citizen of Switzerland, or any other country, would want its central bank to buy stocks.

If the SNB wants a weaker franc, should it be buying assets that go up in value or down in value? And, wouldn't it make sense to leave the stock buying game to professionals in that area? Do you really want Janet Yellen in charge of a mutual fund, or ensuring that banks have adequate capital reserves. It's just another example of why countries should restrain government (and quasi government) officials - otherwise, there will inevitably be mission creep.

Happy Trading!

The Wolf
 

Attachments

  • CHF-daily-Elliott-8-1.PNG
    CHF-daily-Elliott-8-1.PNG
    80.3 KB · Views: 397
Hello traders!

Here's the first video about my wave trading. I've been trading with Elliott Waves for 12 years. I usually share my trading ideas in Russian, but I decided to do the same things in English as well. I have two short trades on EUR/USD, cause in the next few days we can see a bearish rally in wave [3]. Also I trade Dollar Index and if it goes higher, I'm going to increase my position. You can see more trades in the video below:

 
New video about my wave trading :)

[VIDEO]https://www.youtube.com/watch?v=MP5hPzbJGzE[/VIDEO]
 
Market Winning Trade Set-Ups for 08/16/2015

EURUSD-8-16.png

Currency Pair: EURUSD
Closing Price: 1.1107
Entry Order: SELL stop @ 1.1098
Stop loss: 1.1140
Take profit: 1.0911

Analysis: For the past several months I have been recommending buying the EURUSD on pull-backs. Those recommendations were guided based on my analysis of the double-bottom that was formed in this currency pair in the Mar-Apr timeframe. Based on last week's disappointing price action, whereby prices failed to advance in both Thursday and Friday's trading sessions (see the inside-day bars), I am starting to shift my bullish trading bias. I am now starting to believe that the "Double-top" formed in Apr-Jun will be the guiding price pattern going forward. Should prices fail to advance from current levels, it will also confirm the potential descending wedge (bear) pattern. (Final confirmation of the descending wedge pattern would be at the 1.0800 price level). Admittedly, last week I was buffeted between the opposing price patterns (double-bottom and double-top) that are currently in play in the EURUSD. As this pair has been in a sustained and long-term downtrend, I am of the (growing) opinion that the double-top price pattern will prevail, and the next (major) move will be a continuation to the downside.
 
EURUSD Wave Count

It took until Wednesday, but the early week decline and then rally we suggested was exactly what played out. Notice that prices are now testing resistance from the May and June highs, along with the upper parallel of the base channel. This rally isn't complete, though, and we remain bullish. Notice that daily RSI is just under "Sustainable Bull" territory.
EUR-daily-Elliott-8-22.PNG
Yes, we know the wave i high is far away from current prices. But, it shouldn't be breached until prices have pushed much higher first. That's the critical support for our bullish view, although ideally prices will remain well above that level. There's still resistance overhead, so prices will need some backing and filling next week, but we're dip buyers.
EUR-120-Elliott-8-22.PNG
 
GBPUSD Wave Count

The pound's rally certainly didn't measure up to the EURUSD, but that's not to say it wasn't bullish this week. In fact, on the weekly chart (not shown) this week completed a weekly buy signal bar, to go with the prior week's reversal bar. That means we can hold a very aggressive bullish view while prices remain above 1.5458. We don't think prices will be anywhere near that level in a week or two. Be bullish.
GBP-daily-Elliott-8-22.PNG
What's most important on the shorter term chart is the clearly corrective action to the downside shown in both wave (ii) and 2 (And E, and C, you get the idea, right!). We won't be surprised at all to see the pound play a bit of catch-up with the euro to the upside next week. We remain aggressively bullish. A break of the wave (ii) would give us pause, and would potentially suggest that the wave (B) triangle was ongoing, rather than something more bearish. Even under that view, prices will remain above the 1.5400 area on their way towards 1.6100 (or higher). Do notice that 1.5700 has been resistance lately, and any push above there may serve to panic the shorts (On any hint of no Sept rate hike or QE4 perhaps.).
GBP-120-Elliott-8-22.PNG
 
AUDUSD Wave Count

Now, what's most interesting is that AUDUSD didn't fall to a new low as the signs that the global economy is weakening became apparent this week. Remember that AUDUSD has already fallen a long way from its 2011 high (about 35%), and so a bounce isn't out of the question. What could cause Aussie to bounce as the global economy weakens? How about more monetary easing from Australia's largest customer, China, or how about easing monetary policy in Australia? Wait, isn't that heresy? How could monetary easing actually benefit a currency? Ask the euro after Mario Draghi's "whatever it takes" speech and bailout of Greece. Both were forms of monetary easing, yet the euro rallied from 1.20 to 1.40 after those "easing moves." Remember, be careful of relying too much on causation, and instead let the charts do the talking. We can't rule out one more stab lower, but Aussie should be near a bigger rally phase, and that'll be sealed on a push above .7600.
AUD2-daily-Elliott-8-22.PNG
The decline from the .7360 area is corrective, and the bounce from .7200 looks impulsive. That means we should see a near term rally regardless of which count is operative. Be bullish towards the .7440 area early next week, and possibly beyond considering the weaker US dollar we're expecting.
AUD-120-elliott-8-22.PNG
 
NZDUSD Wave Count

NZDUSD showed several bullish divergences into the wave C low, with the final one occurring ABOVE Sustainable Bear territory (lower grey zone). We mentioned at the time that we needed to pay attention to this divergence, and last week showed why. Prices have now pushed higher, with RSI above 50, and we're expecting it to continue.
NZD-daily-elliott-8-22.PNG
Don't stand in the way of higher prices on the shorter term view either. We think wave i of (iii) was a leading diagonal, and prices should soon push the upper boundary of the base channel. Only a drop back below the .6600 area will call into question our bullish view.
NZD-120-elliott-8-22.PNG
 
USDCAD Wave Count

Under both the bullish view and the top alternate, prices are headed higher from above the 1.2925 area. The line between the two counts is Wednesday's low 1.3024. We have five waves up from 1.2952 into 1.3152, with a correction into Wednesday's low. Remaining above that level means wave 5 is underway already. A break of that low means that a triangle of flat correction for wave 4 is the operative view, and considering the strength we're looking from for AUD and NZD, perhaps that makes more sense. The pair to play any USD strength is USDCAD.
CAD-daily-Elliott-8-22.PNG
 
USDJPY Wave Count

Prices have now returned to the breakout level, which means they've really gone nowhere since December, similar to the S&P 500. There's little reason to believe that prices are going to stop here, though given the big bearish bars the last three days. We're going to be sellers of any bounce, partly based on the action in daily RSI. Notice that into the wave B high, RSI turned down from the upper grey zone, which is the "bearish resistance" zone. Now that RSI is back near Sustainable Bear, there's little reason to think prices are going to turn back up on a dime, although we can't completely rule that out until the wave 4 low is taken out.

Happy Trading!

The Wolf
JPY-daily-Elliott-8-22.PNG
 
EURUSD Wave Count

Friday's break of 1.1399 means EURUSD traced out three waves down from the 1.1465 high. So, we're now looking higher into resistance, and as most are focusing on a potential breakout, we see a "sell the range high" type of situation unfolding. Of course, we'll need to see how next week plays out first, but it'll take a break of the up trendline to suggest something more sinister to the downside is developing. Until then, RSI found a bottom in the Bull Support zone (lower blue), which points higher near term, at least to eclipse the wave (a) of Y high.
EUR.PNG
 
GBPUSD Wave Count

GBP.PNG
Same story with GBPUSD - higher into a top. Prices have pushed past the red line, but remember to think of structural resistance more of as a "zone" as opposed to a "single point." So, there's still plenty of overhead resistance despite the push past the internal trendline drawn off the wave (1) low. That said, we need to allow for higher prices before things top out, so perhaps we've got some weak data coming in the US, and some dovish Fedspeak from the bafoons at the FOMC.

As the headline says, central bankers appear to have painted themselves into a corner. When the BOJ "failed to act" last week, the yen rallied and stocks there sold off hard. Since Japan must "print or die" there's little doubt further easing will be coming from Japan. And, with Bernanke, Krugman and the rest of the Keynesian/Monetarist clowns calling for fiscal helicopter drops of cash(Since QEs effectiveness at improving economies has proven to be futile.) we expect nothing less.

The hubris and egos of the central bankers won't allow them to admit failure; instead they will simply pivot to some additional "tools (fiscal printing)" in addition to more monetary stimulus (QE). Part of the reason Bernanke is promoting fiscal printing now is to give his monetary policy failures some cover. If Congress fails to add more fiscal stimulus, Bernanke will blame that, rather than the boom/bust cycle that was turbo charged by absurdly loose monetary policy.

Keep in mind, that the Taylor rule, a Fed created model, suggests the overnight rate should be 2.8% even now! Talk about ignoring data. Listen, monetary policy can't fix structural problems, and when structural problems abound (too much debt and overcapacity) too loose monetary policy makes things worse.
Taylor Rule.PNG
 
AUDUSD Wave Count

We still only have three waves down from the suspected wave (B) top, but we're still bearish. Last week's aggressively bearish stance against AUDUSD has been correct so far. But, a break of the .7766 level, without a new low first would mean our top count is off base. Until that happens, though, we're expecting lower to complete wave (i), which would break the up trendline off the low. Of course, we'll then have to allow for a bounce in wave (ii) which will likely coincide with tops in GBPUSD and EURUSD, and be a huge opportunity for the bears.
AUD.PNG
 
NZDUSD Wave Count

Unlike our other pairs, NZDUSD looks like five down from its recent high. Despite that, the rally has been sharp, and RSI hasn't confirmed that prices have topped. While our top count may be correct, we're awaiting additional evidence that the recently broken up trendline is ready to repel prices. Given the expected upside in the euro and pound, it's conceivable that prices test or slightly exceed our top before succumbing to the larger downtrend.
NZD.PNG
 
USDCAD Wave Count

We don't have much to add to recent comments on USDCAD, except that the "Huge Support" has failed to buoy prices, and it's now "Huge Resistance" for a wave B top and turn lower. Still, we'll have to see the decline find its footing first, and that's been elusive. RSI still hasn't provided in the way of a divergence, and it's still reading "Sustainable Bear" (lower grey zone). So, a bounce is due, and the decline of the past few days looks like an ending diagonal, which means the bounce is likely to be sharp.
CAD.PNG
 

Attachments

  • CAD.PNG
    CAD.PNG
    96.9 KB · Views: 216
  • CAD.PNG
    CAD.PNG
    96.9 KB · Views: 235
USDJPY Wave Count

New money that is borrowed to repay other borrowers is a definition of Ponzi finance. Every country on earth is currently performing its own version of this, but Japan is much further along than any other developed country. Despite its near 0% rates for 20 years, Japan still spends roughly 25% of its budget on interest payments, and its debt to GDP is off the charts at 240%. For comparison, Harvard professors Reinhart and Rogoff in This Time is Different: Eight Centuries of Financial Folly, their seminal work on debt defaults, suggest that problems eventually arise in the 90-100% debt/GDP area. Japan is well past that, which means there is NO WAY OF AVOIDING AN EVENTUAL DEFAULT. The only key word is "eventual," as in, we don't know when.

But, we think Japan will experience an inflationary spiral in Japan as the world goes through a "debt default, no growth" type of recession, rather than a 30s style deflationary depression. Regardless, the larger trend in USDJPY is up, and the only question is when the wave ((2)), or wave II decline, ends and the uptrend resumes.

Now that USDJPY has achieved its Head and Shoulders target off the high, we can again look for a bottom and turn higher. We think the BOJ, despite its "no action" move last week, is committed to further attempting to inflate the yen, as what's the other strategy? Admit defeat and structurally reform? Anyone familiar with Japanese politics, history and sentiment knows that change is not something welcomed, and won't happen until forced upon them. As such, we're looking for prices to bottom in wave (v) over the course of the next week or so, and we'll await a daily reversal candle and follow through day prior to turning bullish again.

JPY.PNG
Happy Trading!

The Wolf
 
Top