You are using an out of date browser. It may not display this or other websites correctly.
You should upgrade or use an alternative browser.
You should upgrade or use an alternative browser.
isatrader
Senior member
- Messages
- 2,965
- Likes
- 136
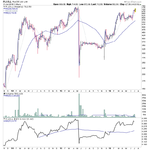
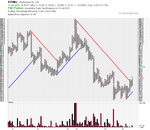
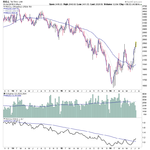
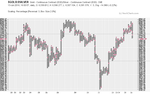
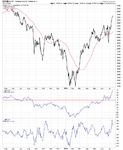
RTHM.L - early in Stage 2A
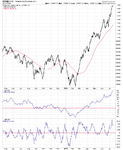
RTHM.L - early in Stage 2A after a multi year Stage 4 decline. 12x the average daily volume today, and over 2x the average weekly volume so far this week.
RTHM.L - early in Stage 2A after a multi year Stage 4 decline. 12x the average daily volume today, and over 2x the average weekly volume so far this week.
Attachments
Atilla
Legendary member
- Messages
- 21,115
- Likes
- 4,305
RTHM.L - early in Stage 2A after a multi year Stage 4 decline. 12x the average daily volume today, and over 2x the average weekly volume so far this week.
I'm into LLOY and BRBY's in a big way at the moment Isatrader, would love to see Stan Weinstein's analysis applied to them if I may request a favour 🙂
isatrader
Senior member
- Messages
- 2,965
- Likes
- 136
I'm into LLOY and BRBY's in a big way at the moment Isatrader, would love to see Stan Weinstein's analysis applied to them if I may request a favour 🙂
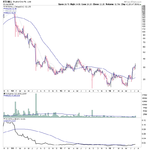
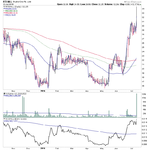
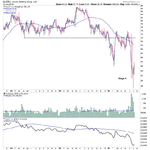
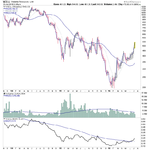
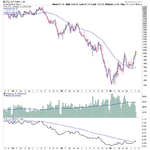
I have LLOY.L as in Stage 4, and BRBY.L is in Stage 4B-, which means "Although not yet “officially” in Stage 1A, stock has now potentially seen its low for the cycle. So it's attempting to move into Stage 1. But hasn't quite got there yet, and could need significant basing time unless there's a heavy volume surge, as it's still under long term resistance.
The relative performance of both is quite bad currently with both well below declining Mansfied RS zero lines still.
Attachments
Last edited:
Atilla
Legendary member
- Messages
- 21,115
- Likes
- 4,305
I have LLOY.L as in Stage 4, and BRBY.L is in Stage 4B-, which means "Although not yet “officially” in Stage 1A, stock has now potentially seen its low for the cycle. So it's attempting to move into Stage 1. But hasn't quite got there yet, and could need significant basing time unless there's a heavy volume surge, as it's still under long term resistance.
The relative performance of both is quite bad currently with both well below declining Mansfied RS zero lines still.
Thank you very much Isatrader, yes they have both had a bad time but with the Brexit fiasco they are recovery plays. So far so good and will hang on to them but if they make LLs prepared to drop them.
Much obliged 👍
Last edited:
Atilla
Legendary member
- Messages
- 21,115
- Likes
- 4,305
A few of the big miners making Stage 2A breakout attempts BLT.L, RIO.L, VED.L
I'm considering moving into this one which was a tip from a friend. 🙄
GLENcore
http://www.londonstockexchange.com/...ny-summary/JE00B4T3BW64JEGBXSET0.html?lang=en
Been watching it. Not sure I understand what's going on with this one as they've maintained dividends against falling earnings.
Thinking commodities on the rise due to further QE and growing bank risk in particular wrt EU.
isatrader
Senior member
- Messages
- 2,965
- Likes
- 136
I'm considering moving into this one which was a tip from a friend. 🙄
GLENcore
http://www.londonstockexchange.com/...ny-summary/JE00B4T3BW64JEGBXSET0.html?lang=en
Been watching it. Not sure I understand what's going on with this one as they've maintained dividends against falling earnings.
Thinking commodities on the rise due to further QE and growing bank risk in particular wrt EU.
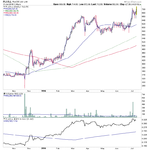
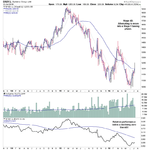
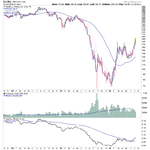
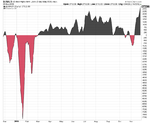
It's attempting a Stage 2A breakout like many of the other stocks in the sector. Is a sector wide move in the basic materials stocks in the world, not just UK. So is nothing to do with fundamentals of the company imo. Purely technical correlation with the sector.
Attachments
Atilla
Legendary member
- Messages
- 21,115
- Likes
- 4,305
It's attempting a Stage 2A breakout like many of the other stocks in the sector. Is a sector wide move in the basic materials stocks in the world, not just UK. So is nothing to do with fundamentals of the company imo. Purely technical correlation with the sector.
Yes much like boats rising and falling with the tides.
Many thanks 🙂
isatrader
Senior member
- Messages
- 2,965
- Likes
- 136
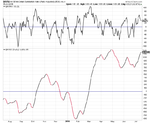
Silver versus Gold
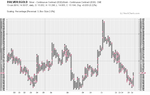
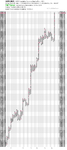
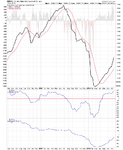
As I've highlighted in the past, Silver has a strong correlation with gold, but during the gold bull markets in the last 20 years it has outperformed gold each time, as you can see from the attached long term P&F charts of the gold/silver ratio.
As you can see from the P&F ratio charts, Silver broke out in June against Gold, which if you compare to the past is good sign for continued outperformance versus gold. So on the next decent pullback, Silver is the stronger place to get in than gold imo.
Attachments
isatrader
Senior member
- Messages
- 2,965
- Likes
- 136
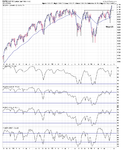
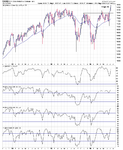
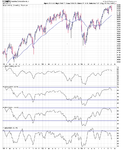
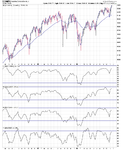
Major US Stock Indexes Update - NYSE, Nasdaq, S&P 500
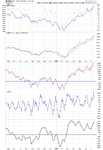
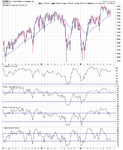
Here's the quick overview charts of the NYSE, Nasdaq, S&P 500 with the US Bullish Percent and Moving Average Breadth.
Note: this week saw further Stage 2A breakouts in the Nasdaq, NYSe and the Dow Jones Industrial Average. So with the broad participation from the various indexes and strong breadth the US market is now in early Stage 2 imo.
Attachments
Last edited:
isatrader
Senior member
- Messages
- 2,965
- Likes
- 136
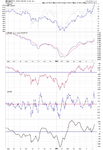
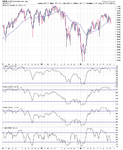
NYSE Advance Decline Charts
Attached is the updated Advance Decline Breadth Charts, including the cumulative AD line, momentum index, cumulative AD volume line, 10 Day AD oscillator and the McClellan Oscillator and Summation Index.
Attached is the updated Advance Decline Breadth Charts, including the cumulative AD line, momentum index, cumulative AD volume line, 10 Day AD oscillator and the McClellan Oscillator and Summation Index.
Attachments
Signalcalc
Veteren member
- Messages
- 4,670
- Likes
- 1,031
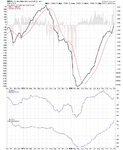
Glencore has a strong correlation with the chart of Copper, so if you 'know' where Copper is headed then you know where Glencore is headed, unfortunately one doesn't lead the other usually.
Last edited:
isatrader
Senior member
- Messages
- 2,965
- Likes
- 136
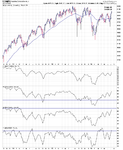
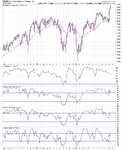
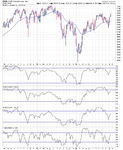
Major US Stock Indexes Update - NYSE, Nasdaq, S&P 500 & DJIA
Overview charts of the Major US Stock Indexes - NYSE, Nasdaq, S&P 500 & DJIA plus the US Bullish Percent and Moving Average Breadth.
Overview charts of the Major US Stock Indexes - NYSE, Nasdaq, S&P 500 & DJIA plus the US Bullish Percent and Moving Average Breadth.
Attachments
isatrader
Senior member
- Messages
- 2,965
- Likes
- 136
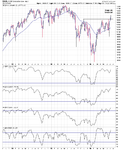
Major US Stock Indexes Update - NYSE, Nasdaq, S&P 500 & DJIA
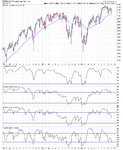
Overview charts of the Major US Stock Indexes - NYSE, Nasdaq, S&P 500 & DJIA plus the US Bullish Percent and Moving Average Breadth.
New highs in the S&P 500, Nasdaq Composite and Dow, but the NYSE is lagging, but close to a potential continuation attempt.
Overview charts of the Major US Stock Indexes - NYSE, Nasdaq, S&P 500 & DJIA plus the US Bullish Percent and Moving Average Breadth.
New highs in the S&P 500, Nasdaq Composite and Dow, but the NYSE is lagging, but close to a potential continuation attempt.
Attachments
isatrader
Senior member
- Messages
- 2,965
- Likes
- 136
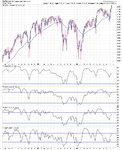
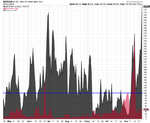
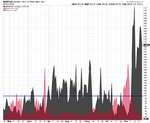
US New Highs New Lows Charts
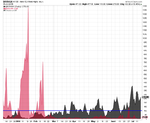
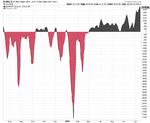
Attached is the NYSE and US New Highs / New Lows charts
Note: the US 5 day New Highs / New Lows chart had it's strongest week all year.
Attached is the NYSE and US New Highs / New Lows charts
Note: the US 5 day New Highs / New Lows chart had it's strongest week all year.
Attachments
Weekly or Weekly AND Daily?
Hi everyone,
being a newbie on this forum, please be patient with my very basic question...
I've read the Weinstein's book and I'm going to read his interview to better understand his strategy. But I can't find a clue regarding the need to use both weekly and daily charts to operate in the markets. In the book, it seems he always refers to weekly charts, but reading this very forum (especially Isatrader's posts. of course...) it seems that we should operate with daily charts too. I've been following Elder's Triple Screen for years, but eventually I've found more suitable for me to avoid all the "noise" of daily charts and switch on the weekly (50 periods), with a small window for a yearly chart (10 periods).
Can you tell me anything about this "trade-off"? What do you think?!
Well.. actually I have a second question, just for Isatrader: in the very first page of this thread you mentioned the Weinstein stages, but divided in more sub-stages. Now, I know that the author referred to stage 2A as the initial breakout and 2B as the first pullback (or following consolidations), but what about e.g. 3A or 4B? Do they come from the author or do they come from you experience (appreciable, indeed)?
Thanks very much!
K.
Hi everyone!
Primarily, congratulations for this forum.
I am a follower of S. Weinstein Method.
Only some questions, especially for Isatrader:
1.- How can I make a screener following the Weinstein's criteria on FINVIZ.COM or another web?
2.- I use Ninjatrader. Is there an indicator for this software to define the diferent stages according to Mr. Weinstein?
Sincerely,
Similar threads
- Replies
- 2
- Views
- 5K
- Replies
- 170
- Views
- 31K
- Replies
- 9
- Views
- 17K
- Replies
- 0
- Views
- 2K