goodtyneguy
Active member
- Messages
- 146
- Likes
- 9
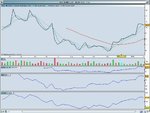
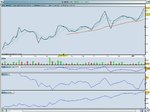
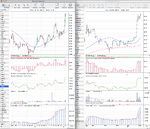
Anyone for cotton pickin ?
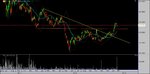
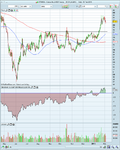
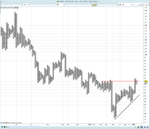
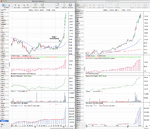
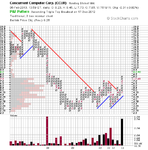
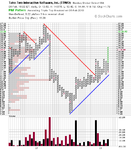
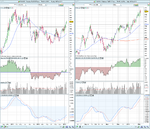
Inverse H&S and "W" pattern, can someone check the RS. Plenty of potential in this one!
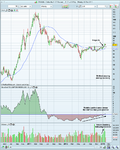
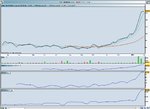
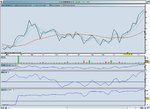
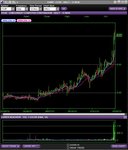
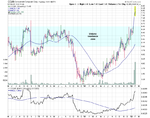
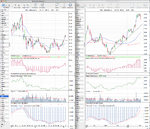
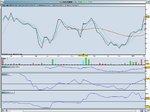
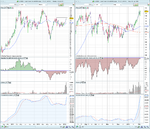
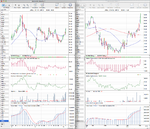
Page 332 shows an example of an orange juice trade, there was overhead resistance and the volume did not look very good on the breakout. Have we any evidence to say that we can ignore these with regard to futures trading?
Inverse H&S and "W" pattern, can someone check the RS. Plenty of potential in this one!
Page 332 shows an example of an orange juice trade, there was overhead resistance and the volume did not look very good on the breakout. Have we any evidence to say that we can ignore these with regard to futures trading?