Stan Weinstein's Stage Analysis

So, it's probably best I just use chartmill when I want to check this aspect of the method. Having said that I was subscribed to ProRealTimes' EOD service (outside of IG, the main product) sometime ago but did not use it. I have reactivated it now and hopefully I can configure it for the method. I am pretty sure I saw PRT mentioned earlier on in the thread..... anyone?

I've just had a look in ProRealTime for you and the Mansfield RS is available, so you don't need to code it yourself. Click on the "Add Indicator" button and scroll down to "Mansfield's Relative Strength".

Make sure you set it to the "S&P 500 Index" and remember to adjust the Nbr periods for the weekly to 52 and the daily to 200. What I did was setup the weekly chart and saved templates as Weinstein Weekly, and the daily chart as Weinstein Daily, so I can just click on the template I want in the future.

mansfield_pro_real_time.pngpro_real_time_weekly.pngpro_real_time_daily.png

As an aside, anyone noticed what looks like a nice H&S forming on the Nazzy, lower volume so far on the right side. Apple fell out of bed in out of hours trading yesterday, I presume earnings were down.

I believe Apple's earnings were actually up, it made a profit of $13.1 billion and sold 28 percent more iPhones and 48 percent more iPads, but apparently investors expected more. The sentiment has turned clearly.
 
Last edited:
I've just had a look in ProRealTime for you and the Mansfield RS is available, so you don't need to code it yourself. Click on the "Add Indicator" button and scroll down to "Mansfield's Relative Strength".

Make sure you set it to the "S&P 500 Index" and remember to adjust the Nbr periods for the weekly to 52 and the daily to 200. What I did was setup the weekly chart and saved templates as Weinstein Weekly, and the daily chart as Weinstein Daily, so I can just click on the template I want in the future.

I believe Apple's earnings were actually up, it made a profit of $13.1 billion and sold 28 percent more iPhones and 48 percent more iPads, but apparently investors expected more. The sentiment has turned clearly.

ohhh, thanks ISA, that's really good of you. I am quite familiar with PRT through spreadbetting 25p a point on stocks in IG. I quite like it but there is number of ways it is deficient, continous price data past current contracts on most futures is not available for one, unless this is just specific to IG's offering. Looks like PRT is the way forward for charting for me at the moment. Time for bed now though, will play with that later today.

VFC, looks very good!
 
Last edited:
Select Comfort Corp (SCSS) looks like an interesting Stage 4 continuation move today. It's got some volume support to work through at the 20 to 22 zone and a rising long term trend line, but it's relative performance versus the S&P 500 and the Consumer Discretionary sector is under performing the price action, plus it's SCTR (SP600) rating is only 3.7 - which is stockcharts relative performance rankings for the SmallCap S&P 600 and means it's one of the weakest stocks in the S&P 600. Zero being the weakest and 100 being the strongest RS. Attached are the charts including a relative performance chart that shows the S&P 500 and sector comparisons with 30 week MAs on both which I like to look at for a direct comparison to price in addition to the Mansfield RS. And it's a little bit faster as it's a 30 week MA instead of the 52 week MA on the Mansfield RS chart.
 

Attachments

  • sc-38.png
    sc-38.png
    29.3 KB · Views: 332
  • sc-39.png
    sc-39.png
    39.5 KB · Views: 347
  • sc-37.png
    sc-37.png
    41.4 KB · Views: 337
  • SharpChartv05-14.png
    SharpChartv05-14.png
    38.9 KB · Views: 334
Last edited:
Re: VF Corp (VFC)

Attached is a potential for a Stage 4 breakdown that is challenging the bottom of it's Stage 3 range. Relative performance is weakening and well below the zero line. Volume isn't relevant on Stage 4 breakdowns, so it doesn't matter that it's only light. There is however reasonably close support in the low 130 zone and the 30 week MA is slightly rising, but that would rollover if it breaks here.

The daily ATR(200) is 3.177, so recent range would give a good level of risk at just over 3 x ATR(200) to place a stop above.

I'd suggest that the Stage 4A breakdown point would be a daily close below the 146 level that has been strong support as you can see in the attached P&F chart horizontal volume, and ideally a weekly close below that level as well.

Just reviewed the chart for VFC, this chart violates one of Stans major rules which is to never short a stock with a rising 30 MA. The 30-week MA is still rising for VFC. Its showing signs of distribution but until it rolls you have very strong change of gettting "whipped" as Stan calls it and the price goes back and forth (above and below) the 30 MA as distribution takes place over many months. Eventually the 30 will roll over or continue higher as it is still rising. Too risky and violates a core rule for shorting. Thanks good luck with VFC if you are short.
 
Re: VF Corp (VFC)

Just reviewed the chart for VFC, this chart violates one of Stans major rules which is to never short a stock with a rising 30 MA. The 30-week MA is still rising for VFC. Its showing signs of distribution but until it rolls you have very strong change of gettting "whipped" as Stan calls it and the price goes back and forth (above and below) the 30 MA as distribution takes place over many months. Eventually the 30 will roll over or continue higher as it is still rising. Too risky and violates a core rule for shorting. Thanks good luck with VFC if you are short.

Thanks for your observations on VFC, I took it as a "heads up" for a watchlist candidate from ISAtrader.

ISAtrader said:
Attached is a potential for a Stage 4 breakdown
 
Re: VF Corp (VFC)

Just reviewed the chart for VFC, this chart violates one of Stans major rules which is to never short a stock with a rising 30 MA. The 30-week MA is still rising for VFC. Its showing signs of distribution but until it rolls you have very strong change of gettting "whipped" as Stan calls it and the price goes back and forth (above and below) the 30 MA as distribution takes place over many months. Eventually the 30 will roll over or continue higher as it is still rising. Too risky and violates a core rule for shorting. Thanks good luck with VFC if you are short.

Hi Rewardz, thanks for the feedback on VFC, but I don't think you read the post as I clearly stated that it was challenging the bottom of it's Stage 3 range and that the 30 week MA is slightly rising. I also said a Stage 4A breakdown point would be a daily close below the 146 level and ideally a weekly close below that level as well.

goodtyneguy is correct in that I was giving a heads up on a Stage 3B stock with potential to go into early Stage 4A. However, today's price action has shown that it's not ready yet, but it will be one to watch closely imo, as it's at the crucial point.

Attached is my chart that uses the 30 week weighted MA that I prefer personally as it shows stage 3 and stage 1 ranges much clearer and was used in all the Mansfield weekly chart examples from the book. It has been negative for 6 out of the last 7 weeks, so hence the comment the 30 week SMA would rollover if it breaks here, as the weighted MA front runs the simple MA.

Don't be too literal with the rules. If it's in 3B and the 30 week SMA is slowing down and price is below it, then there's good odds that it will turn down on a breakdown.

Attached is a potential for a Stage 4 breakdown that is challenging the bottom of it's Stage 3 range. Relative performance is weakening and well below the zero line. Volume isn't relevant on Stage 4 breakdowns, so it doesn't matter that it's only light. There is however reasonably close support in the low 130 zone and the 30 week MA is slightly rising, but that would rollover if it breaks here.

The daily ATR(200) is 3.177, so recent range would give a good level of risk at just over 3 x ATR(200) to place a stop above.

I'd suggest that the Stage 4A breakdown point would be a daily close below the 146 level that has been strong support as you can see in the attached P&F chart horizontal volume, and ideally a weekly close below that level as well.
 

Attachments

  • VFC_Weekly_25-1-13.png
    VFC_Weekly_25-1-13.png
    128.9 KB · Views: 332
Last edited:
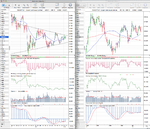
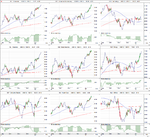
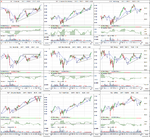
Attached is the usual major charts for Stage Analysis and relative performance table and also a few extra charts of interest this week, which are the Shanghai Composite, Dow Transports and the Apple chart.

As usual I've also updated the Market Breadth charts in the other thread, such as the advance decline line, momentum index, new highs - new lows etc, so that we determine what the the weight of evidence from the market internals is suggesting: http://www.trade2win.com/boards/technical-analysis/147476-market-breadth-25.html#post2061376

attachment.php


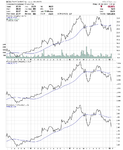
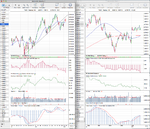
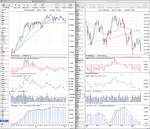
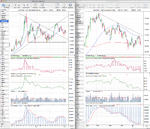
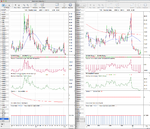
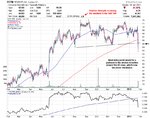
There are a few interesting charts this week imo, one set in particular that stands out is the US 10 and 30 Year Treasuries charts, as they continue to test the lower support from the major Stage 3 range. I noted on Dec 18th that the US 30 year Treasuries chart was making a potential Stage 4A breakdown, and since then after initially bouncing around the 200 day MA, it's moved slightly lower, but has yet to breakdown completely below the major support, and is now below the August low on the 30 year chart, but still slightly above on the 10 year chart. So I continue to monitor these charts closely as a strong breakdown would carry stocks even higher and looks possible as the treasuries continue to weaken. So I'd rate the treasuries charts both in Stage 4A, which to be averted would need a reversal back above the recent swing highs. Otherwise the swing targets for the Stage 4 move are 136 on the 30 year chart and 127 on the 10 year chart imo.

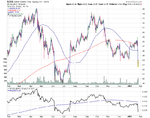
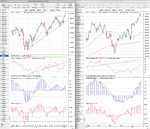
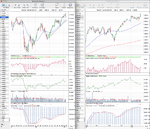
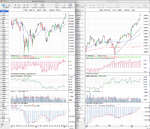
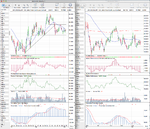
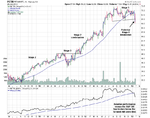
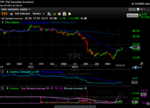
The majority of stock indexes continued to breakout to new highs and confirmed they are in Stage 2 continuation moves. If you look at the rRelative 30 Week indicator at the bottom of the S&P 500 chart - which is my own custom indicator, that simply measures the distance that the price is above the 30 week weighted moving average. Currently the S&P 500 price is 5% above the 30 week WMA, which on a historical basis now puts the S&P 500 into the bullish zone - which is anything above 5%. My other custom indicator which measures the 30 week WMA positive or negative momentum is also positive and rising. And so although it feels like it should be pulling back to me, the evidence from the charts so far suggests sticking with it as the broad stock market is in Stage 2 and can stay overbought for a long time. But be aware that risk is now very high, as the short term breadth measures have reached extreme levels - which is never a good time to buy imo.

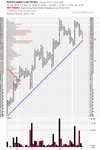
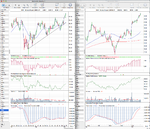
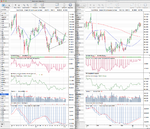
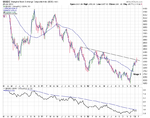
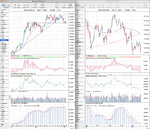
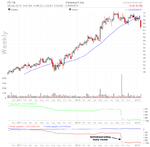
Copper's (HG) chart is beginning to interest me, as the price action is becoming more squeezed in it's Stage 1 range, which is over a year old now. The downtrend line has three strong touch points and the 30 week MA is rising, so for a trader entry I'm looking for a move into Stage 1B, which would be a close above the recent swing high and the trend line imo, and could give a fast move to test the top of the major Stage 1 range at the $4 level.

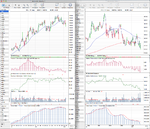
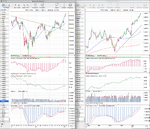
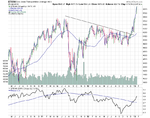
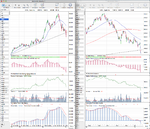
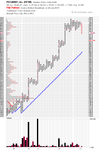
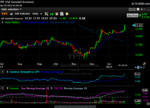
I included the Shanghai Composite chart this week as it's made a strong move off it's lows (short covering rally) and this week tested it's one year downtrend line and rolled over. The 30 week SMA has gone flat, and the relative performance versus the S&P 500 is below the zero line still, but has recovered significantly. So I'd rate it as in Stage 1 here.
 

Attachments

  • SPX_Weekly_25_1_13.png
    SPX_Weekly_25_1_13.png
    148.1 KB · Views: 363
  • NDX_Weekly_25_1_13.png
    NDX_Weekly_25_1_13.png
    139 KB · Views: 409
  • IWM_Weekly_25_1_13.png
    IWM_Weekly_25_1_13.png
    128.1 KB · Views: 403
  • NYA_Weekly_25_1_13.png
    NYA_Weekly_25_1_13.png
    136.3 KB · Views: 358
  • DAX_Weekly_25_1_13.png
    DAX_Weekly_25_1_13.png
    136.7 KB · Views: 361
  • TY_10yr_Treasuries_25_1_13.png
    TY_10yr_Treasuries_25_1_13.png
    134.1 KB · Views: 346
  • CL_Weekly_25_1_13.png
    CL_Weekly_25_1_13.png
    137.3 KB · Views: 341
  • HG_Weekly_25_1_13.png
    HG_Weekly_25_1_13.png
    135.4 KB · Views: 330
  • GC_Weekly_25_1_13.png
    GC_Weekly_25_1_13.png
    134.5 KB · Views: 349
  • FTSE100_Weekly_25_1_13.png
    FTSE100_Weekly_25_1_13.png
    139.5 KB · Views: 385
  • TRAN_Weekly_25_1_13.png
    TRAN_Weekly_25_1_13.png
    34.1 KB · Views: 289
  • SSEC_Weekly_25_1_13.png
    SSEC_Weekly_25_1_13.png
    28.4 KB · Views: 277
  • VIX_Weekly_25_1_13.png
    VIX_Weekly_25_1_13.png
    126.8 KB · Views: 330
  • DX_Weekly_25_1_13.png
    DX_Weekly_25_1_13.png
    135.2 KB · Views: 401
  • US_30yr_Treasuries_25_1_13.png
    US_30yr_Treasuries_25_1_13.png
    135.5 KB · Views: 336
  • AAPL_Weekly_25_1_13.png
    AAPL_Weekly_25_1_13.png
    122 KB · Views: 355
  • Major_Charts_RS_list_25_1_13.png
    Major_Charts_RS_list_25_1_13.png
    25.3 KB · Views: 1,672
Last edited:
US Industry Sectors

Attached is the updated US Industry Sectors charts and relative performance table. Technology (XLK) moves back to bottom of the table, but for the majority of the other sectors new highs continue to be hit - with seven of the nine sectors now making Stage 2 continuation moves. Financials (XLF) continues to hold the top spot for another week, followed by Consumer Discretionary (XLY) which moved into second place this week.

P.S. I've also been continuing to update the opening post to organise the threads posts and create a contents list or sorts. So let me know if there's anything else that you think should be included in the opening post links. http://www.trade2win.com/boards/technical-analysis/134944-stan-weinsteins-stage-analysis.html#post1675606

attachment.php
 

Attachments

  • US_Industry_Sectors_list_25_1_13.png
    US_Industry_Sectors_list_25_1_13.png
    21.1 KB · Views: 1,611
  • US_Industry_Sectors_D_25_1_13.png
    US_Industry_Sectors_D_25_1_13.png
    118 KB · Views: 414
  • US_Industry_Sectors_25_1_13.png
    US_Industry_Sectors_25_1_13.png
    123.3 KB · Views: 399
Last edited:
PETsMART (PETM) - Potential Stage 4 Breakdown

Attached is the charts for PETsMART, which has today had a big drop after Nomura cut its rating on the pet supply retailer to "reduce" from "neutral," citing e-commerce competition and a slower pace of margin expansion.

The 9% drop, put PETM through it's Stage 3 base support line that's formed over the last 6 months or so, and moved it below it's relative performance zero line (52 week MA of PETM/SPX). So imo, it's now a potential Stage 4A, but will need to close the week below the breakdown level for confirmation, ideally 64 or below.

As it had such a sharp drop through the support today, the ideal entry point would be a pullback towards the trendline around the 65 level and reversal back down imo. But the major horizontal volume support shown on the P&F chart is at 67, so it could easily rebound to there before meeting some resistance, although you'd want it to stay closing below the 200 day MA - which is currently at 66.30

It's one of the weakest stocks in the S&P 500 at 15th from the bottom in the S&P 500 relative performance table: StockCharts Technical Rankings - S&P 500, so it looks like a reasonable Weinstein candidate for consideration. And I'd give a rating of a "B" for potential - as also attached is the effective volume chart, which shows that an institutional player dumped a large amount of stock around the 70 level in September and today's selling was mainly large player volume as well.

The initial swing target is around the 57 level, and daily ATR(200) range is 1.187, so you'd need roughly a 5 x ATR(200) risk on a stop above the recent swing high for a trader position. Which is a bit high, as I prefer it to be around the 3 x ATR(200) personally. But acceptable if you're going for a bigger target than the initial swing target and hoping to ride a long Stage 4 decline.

For disclosure: I'm not in it myself; this is just a heads up of a new potential Stage 4 breakdown that I came across that I thought might be interesting to someone else on the thread and is good practice for me personally in identifying the breakdowns/breakouts as they happen.
 

Attachments

  • PETM_Weekly_28_1_13.png
    PETM_Weekly_28_1_13.png
    28.1 KB · Views: 361
  • PETM_Daily_28_1_13.png
    PETM_Daily_28_1_13.png
    34.7 KB · Views: 341
  • PETM_PnF_28-1-13.png
    PETM_PnF_28-1-13.png
    37.9 KB · Views: 296
  • PETM_Weekly_EF.png
    PETM_Weekly_EF.png
    28 KB · Views: 382
Last edited:
Thanks ISA, another one on the watchlist. I have n't had time to set up PRT charts yet so I've just popped in quickly to mention VNM. Market vectors vietnam ETF, broke out today into stage 2 I believe if you or anyone else wants to take a look at it.

Cheers
 
Hey Is Stage Analysis of Stan Applicable or Not,Practically?
I'm asking it to ISATrader.

Hi Vinit, the simple answer is yes, as otherwise I wouldn't have spent the last few years researching and testing the method. If you are interested in using the method, then I suggest reading the book a few times at least and writing down questions and taking notes, and then going though the whole thread and developing your understanding of it further before forward testing it for yourself. You can paper trade while you are learning it or just trade a small account until you are confident. Another trader that did an article on here has been using it successfully since 2005 called sharehunter.

I've recently updated the opening post with useful links in the thread, so that's a good starting place once you've read the book. http://www.trade2win.com/boards/technical-analysis/134944-stan-weinsteins-stage-analysis.html#post1675606
 
ISAtrader, Another FAQ to add to the list :LOL:

No I'm Investing.I have read the book of Stan Weinstein Twice and it has helped me in investing. Though I dont have any Software indicating Stage. Please help me by advising Which Software wiil be helpful to determine Stage Analysis in India Particularly.
 
No I'm Investing.I have read the book of Stan Weinstein Twice and it has helped me in investing. Though I don't have any Software indicating Stage. Please help me by advising Which Software will be helpful to determine Stage Analysis in India Particularly.

And unfortunately you won't find any software that can identify the stages. It's a manual method that requires a lot of due diligence and research. Once you understand how to identify the stages correctly, then you can visually scan through your chosen market and identify potential candidates. There are obviously scanners that can help to order by relative strength, new highs, volume etc, which have been mentioned throughout the thread, but I'm doubtful that they will have the Indian market unfortunately. So it will require hard work on your part to come up with your own watchlists.
 
And unfortunately you won't find any software that can identify the stages. It's a manual method that requires a lot of due diligence and research. Once you understand how to identify the stages correctly, then you can visually scan through your chosen market and identify potential candidates. There are obviously scanners that can help to order by relative strength, new highs, volume etc, which have been mentioned throughout the thread, but I'm doubtful that they will have the Indian market unfortunately. So it will require hard work on your part to come up with your own watchlists.


tHANK YOU FOR YOUR REPLY. BUT IN CASE YOU FIND ANY SOFTWARE PRACTICALLY HELPFUL FOR INDIAN STOCK MARKETS, PLEASE LET ME KNOW.
 
Has anyone heard of any update coming from Stan regarding his outlook on the market today? In his last interview with the Financial Sense newshour, Stan predicted that the market would be lower in the following 6 months.
 
The following stocks that have been mentioned here have all come back to their B.O. levels.

XXIA
F
RIMM

Owing to the volume characteristics I'm seeing these as potential failures. I have been long RIMM since the break out with a stop under the 50dma, any thoughts?

Cheers
 
bought these on open as a trade the gap breakout play, but looking nmore closely maybe going into a valid stage2..
 

Attachments

  • ypf.png
    ypf.png
    65.9 KB · Views: 299
  • ypf1.png
    ypf1.png
    65.3 KB · Views: 267
Has anyone heard of any update coming from Stan regarding his outlook on the market today? In his last interview with the Financial Sense newshour, Stan predicted that the market would be lower in the following 6 months.

He's done four interviews on the financial sense newshour since November 2011, and so if it follows the same pattern going forward then I'd expect an interview on there around the end of February.

I'd take the prediction with a pinch of salt, as he himself admitted in the interview that he gets it wrong from time to time, as the market does what the market wants to do. But at the time of the interview his weight of evidence was pointing towards a Stage 4 correction beginning. But it turned out to be a false breakdown at that time and we've now made a Stage 2 continuation move - which has invalidated that theory to a certain degree; although the markets are near the tops of their normal ranges and so risk is currently very elevated imo, and so he may yet get another chance to be correct, as there's still three months left in the moving into Stage 4 in the next 3-6 months prediction.

You can see another example of this in his "Technically Speaking" book interview, as he was speaking about the market topping out then in late 1997, and it then rallied strongly through the first half of 1998 before a strong correction back to the top area he was talking about and then carried on higher for a few more years as the bullish euphoria took hold in the tech bubble.

No ones infallible, and we don't have access to the weekly updates of the GTA report and so he could well have changed his view altogether. As the last one I do have from 19th November he called a short term bottom, and to do "trimming" on oversold shorts, with an eye toward shorting once again on the next oversold rally, but that nothing in the Weight of Evidence had caused them to change their long term view. But we won't know if he's changed his long term view since then until the next interview; so all we can do is own research and decide for ourselves what Stage the market is in and where to allocate our capital accordingly.
 
Last edited:
Top